Towards a Periodic Table of Lizard Niches
© Eric R. Pianka (plus 4 co-authors -- see below)
Keywords: Niche diversification, niche dimensionality, evolutionary convergence, lizard ecology, niche hypervolume, clade niche breadth and overlap

|
Robert MacArthur first proposed the concept of a periodic table of niches to me at Princeton in 1965.
Constructing such a niche scheme has been a long-term goal of mine for half a century but has taken
this long to come to fruition. In a review of the lizard ecological niche (Pianka 1993), I emphasized
five major dimensions: space, time, food, reproduction, and escape. Following the approach proposed
by Winemiller et al. (2015) for constructing what they termed periodic tables of niches
conceptually analogous to the periodic table of elements as envisioned by Pianka (1974), we compiled
such a dataset on the ecology of desert and Neotropical lizards.

Data for five major niche dimensions (54 variables) were assembled for 134 species of lizards representing 24 of the 38 extant families (63% taxonomic coverage). Niche dimensions include habitat use (5 microhabitat variables, plus 8 morphological variables directly related to locomotion and use of microhabitats), trophic ecology (foraging mode plus dietary proportions based on 7 major food categories), life history (10 variables), defense (14 escape tactics), and metabolism (diel activity, 4 thermoregulatory variables, plus 4 climate variables). Multivariate statistical analysis captures 66 % of the overall variance in the first three dimensions of this 50+ niche hypervolumr (Table 1). The first axis is dominated primarily by body size, foraging mode, and clutch size. The second corresponds to metabolism plus terrestrial versus arboreal microhabitat. The third axis represents life history, diet, and time of activity. The niche, a central concept in ecology, describes not only the environmental conditions required for positive fitness and survival, but also the organism's potential impact on its environment. The niche concept has had a long and sometimes controversial history in ecology (Chase and Leibold 2003; Colwell and Rangel 2009). Some ecologists even have argued against use of the term because the word has been used in so many different ways (Margalef 1968; Williamson 1972). The first ecologist to use the word was Joseph Grinnell (1917), for whom the niche included everything that affected the existence of a species at a given location, including abiotic factors (temperature, rainfall, and geomorphology) as well as biotic factors (food, competitors, mutualists, parasites, predators, mates, nest sites, and shelter). Later, Grinnell (1928) linked the niche to the concept of ecological equivalents, convergent species with similar ecologies found in different geographic regions. Charles Elton (1927) defined the niche as "the animal's place in its community, its relations to food and enemies." Elton imagined a behavioral niche, comparing a species' niche to its profession: "When an ecologist says 'there goes a badger' he should include in his thoughts some definite idea of the animal's place in the community to which it belongs, just as if he had said 'there goes the vicar'." Elton's "functional niche" is essentially a measure of a population's phenotype. Perhaps the most influential treatment of the niche concept was that of G. E. Hutchinson (1957), who proposed a hypervolume definition encompassing all environmental conditions under which a given target species has a positive rate of increase. Hutchinson distinguished a virtual fundamental niche from a narrower realized niche. In accordance with this Hutchinsonian concept, niches have often been modeled as series of bell-shaped resource utilization curves, each corresponding to a particular resource or niche dimension (MacArthur 1970; MacArthur and Levins 1967; Pianka 1976; Schoener 1977). Regardless of which concept is adopted, niches are multidimensional and dynamic, responding to temporal and spatial variation in abiotic conditions, resources, and competitor and predator populations, among other things (Hutchinson 1957; Pianka 1976; Schoener 1977; Chase and Leibold 2003; Goodyear and Pianka 2011; Holt 2009; Colwell and Rangel 2009). This complexity poses a great challenge to empirical efforts to describe and compare ecological niches. Nevertheless, the multitude of known or suspected convergences in many taxa across the globe suggests that construction of a niche scheme, a framework analogous to chemistry’s periodic table of elements, might be possible (Pianka 1974). Countering criticism of the idea of periodic tables in ecology (Steffen 1996), Winemiller et al. (2015) argued that ecologists, natural resource managers and conservationists already use a variety of methods that rely on functional traits and niche classification criteria, and therefore, standardized methods for creating niche frameworks need to be explored. They proposed an approach that uses functional traits data organized according to five fundamental niche dimensions to produce two types of niche classification schemes––one that facilitates analysis of species relationships within the multivariate niche space (continuous periodic tables), and one that classifies species into niche categories (discrete periodic tables). Given the multidimensional nature of niches, the framework proposed by Winemiller et al. (2015) is not structurelly equivalent to the periodic table of elements, rather it is conceptually analogous. As a first step toward this complex challenge of creating a niche ordination and classification framework for a major taxonomic group, we analyze lizard niches using extensive ecological data gathered by ERP and LJV during the course of lizard community ecology research conducted in diverse habitats on four continents over the last half century. Our analysis treats species' niches as static entities, an obvious false assumption, but one that allows for broad comparisons to facilitate development of a general theory of niches. We employ the approaches recently proposed by Winemiller et al. (2015) that use multivariate statistics for species ordination within niche space and species classification based on components of niche dimensional sets. Lizards are among the most taxonomically and ecologically diverse groups of tetrapod vertebrates. Of the 10,272 extant reptile species (birds excluded), 9,905 (96.4%) are squamates. Snakes are represented by 3,576 species (34.7% of reptiles) and amphisbaenians by 193 species (1.9% of reptiles). Although some lizards, such as the pygopodid Lialis, are ecological analogues of snakes, we could not include snakes or amphisbaenians because complete data for all variables and niche dimensions required for this study are lacking. The remaining squamates are referred to as lizards, even though both snakes (Serpentes) and amphisbaenians (Amphisbaenia) are nested among the currently recognized 38 lizard families (Uetz 2016a). Lizards are currently estimated to comprise 63.4% of all reptiles, and clearly are among the most taxonomically and ecologically diverse groups of tetrapod vertebrates. Except in very cold regions, lizards occur virtually everywhere that still contain relatively undisturbed natural habitats, and a few species even persist in degraded areas. Like other ectotherms, lizards obtain their body heat solely from the external environment, as opposed to endotherms such as birds and mammals that produce their own heat internally by means of oxidative metabolism. Moreover, along with other ectotherms such as insects, lizards are low-energy animals (Pough 1980). Bennett and Nagy (1977) underscore the great "economy of the saurian mode of life" by pointing out that "one day's food supply for a small bird will last a lizard of the same body size more than a month." Ectothermy has distinct advantages over endothermy under harsh and unpredictable conditions (Schall and Pianka 1978); by means of this thermal tactic, lizards can conserve water and energy by becoming inactive during the heat of midday, during resource shortages, or whenever difficult physical conditions occur (such as during heat waves or droughts). Endotherms must endure these inhospitable periods at a substantially higher metabolic cost or migrate to more hospitable regions. Ectothermy thus confers lizards with an ability to capitalize on scant and unpredictable food supplies, presumably giving them a competitive advantage over endotherms in resource-scarce and unpredictable environments (Dunham 1978). Most lizards are insectivorous and hence relatively high in the trophic structure of their communities: as a result of this and the fact that lizards attain such high abundances, competition for limited resources is probably common and a significant driver of niche diversification (Pianka 1986, 1993). Lizards usually ingest prey items intact, greatly facilitating stomach content analyses of their trophic relationships. Indeed, lizards have proven to be exceedingly tractable subjects for the study of natural history and ecology (Huey et al. 1983; Pianka 1986; Vitt et al. 2003; Losos 2009). According to Schoener (1977), "lizards have not only proven ecologically exciting in their own right, but they may well become paradigmatic for ecology as a whole." In a review of the lizard ecological niche, Pianka (1993) emphasized five major dimensions: space, time, food, reproduction, and escape. Following the approach proposed by Winemiller et al. (2016) for constructing what they termed periodic tables of niches, we compiled a dataset for desert and Neotropical lizards that includes variables associated with functional morphology, habitat and microhabitat, anatomy, foraging mode, diet, life history, diel activity, thermoregulation, and defensive tactics. Overall, 134 lizard species representing 24 of the 38 extant families (Uetz 2016b) were analyzed using multivariate methods for ordination and classification. Lizard niche dimensions appear to evolve in concert; for example, recent evidence indicates synchronous transitions in life history and trophic traits. Some lizard clades reveal great dietary or life history diversification, whereas others do not. The families in which Mesquita et al. (2016) found phylogenetic structure for life history traits were nearly the same as those identified by Vitt and Pianka (2005) as having phylogenetic structure with respect to diet, with a few exceptions, such as Anguidae. In addition, the families in which Mesquita et al. (2016) did not detect phylogenetic structure also were similar, mainly families within the Gekkota (Vitt and Pianka 2005; Vitt et al. 2003), even though a different phylogenetic hypothesis was used. These similarities further suggest that many ecological traits are correlated and coevolved (Cooper Jr. 2007; Goodman et al. 2009; Huey and Pianka 1981; Pianka 1993; Pyron and Burbrink 2009; Reilly et al. 2007; Shine and Schwarzkopf 1992; Vitt and Congdon 1978; Vitt and Pianka 2005; Vitt et al. 2003). These observations hint as to how to construct a periodic table of lizard niches. If dietary and life history dimensions covary, much of the variation in lizard ecology might be captured within a space of relatively low dimensionality. Combined with a thermoregulator-thermoconformer axis and the trade offs between foraging mode and reproductive tactics (Vitt and Congdon 1978; Huey and Pianka 1981), we attempt to develop a general theory for the evolution of niche space occupied by lizards. Our challenge is to reduce dimensionality and to identify taxa signaling convergent evolution. Specific goals of this study are: 1) to identify key components of lizard niches and to compile data for as many lizard species as possible in order to build a global dataset based on standard criteria for as many variables as possible representing the 5 major niche dimensions proposed by Pianka (1993) and Winemiller et al. (2016); 2) to analyze these data to create a low dimensionality periodic table of niches for lizards (niche ordination scheme); 3) to examine relationships of niche dimensional gradients to one another; 4) to compare regional differences in lizard niche diversification; 5) to compare niche diversification of major phylogenetic lineages; and 6) to identify convergent species pairs. We compare and evaluate two hypotheses. The null hypothesis (H1) is that clades evolve to fill contiguous regions in niche space, recognized as niche conservatism (Holt 1996; Wiens et al. 2010). The alternative niche convergence hypothesis (H2) states that some lineages depart from other members of their own clade and evolve characteristics of other clades (Grinnell 1928; Luke 1986; Revell et al. 1997; Blom et al. 2016; Edwards 2014; Edwards et al. 2016). Figure 1. Left: H1 Niche conservatism -- clades map on to niche space. Right: H2 Niche convergence -- some lineages diverge from other members of their clade and converge on members of other clades (green lines). Evidence for H2 supports the periodic table hypothesis (Figure by Laurie J. Vitt). Data Data used here were collected by ERP (71 desert species) and LJV (53 Neotropical species) over many decades. We searched the literature for comparable data for other species but were able to extract complete data for all five major niche dimensions from only ten additional species. Although our sample is relatively small, it has taken two lifetimes of dedicated fieldwork to collect this amount of detailed information for so many species. Data were obtained on all lizards of both sexes (with the exception of certain life history variables) and age categories. ERP and LJV used the same criteria to take lizard measurements in their studies. Some variables had to be excluded from analyses when discrepancies occurred. Although several sources of variation are associated with the data used (sex bias, age, seasonal differences, etc), consistency in the methods used over the years and between ERP and LJV allowed us to construct a database of unique characteristics. Some variables are continuous, and others are discrete. The authors agreed on criteria to classify categorical variabless, leading to standardized criteria for all included species. Among the 50+ total independent variables, variables with direct relationships to a given major niche dimension were selected and assembled into five datasets for analysis as follows. Lizards inhabit a broad range of habitats, including deserts, grasslands, chaparral, rock outcrops, deciduous forest and rainforest. Others are semiaquatic. Many lizards are diurnal, but most geckos are nocturnal. Some pygopodids are crepuscular. Certain species of lizards are climbers, others are subterranean or live in leaf litter, whereas others are surface dwellers (although most lizards exploit burrows as retreats). Among the latter, some tend to be found in open areas whereas others frequent the edges of vegetation. Because such spatial and temporal differences limit the frequency of encounters between species as well as expose them to differing food resources, any potential effects of interspecific competition would tend to be ameliorated. Indeed, avoidance of competition is perhaps the most plausible basis for the evolution and maintenance of such microhabitat differences. Traits allowing for more efficient use of resources may be shaped by natural selection to avoid competition among closely related sympatric species, and may generate specialized ecomorphs (Brown and Wilson 1956; Hutchinson 1959, 1978; Losos 2009; Williams 1972, 1983). Several ecomorphotypes have been proposed for species adapted to various habitats (Vanhooydonck and Van Damme 1999). Ground-dwelling species tend to have laterally compressed bodies and long limbs that provide greater lateral flexion, enhance maneuverability and allow them to reach higher speeds (Snyder 1954; Van Damme et al. 1997). On the other hand, with the exception of chamaeleons and other lizards with adhesive structures in their feet, species that climb tend to be dorsoventrally compressed, which lowers the body’s center of gravity, and reduces the chances of toppling back while climbing (Jaksić et al. 1980; Pounds 1988; Sinervo and Losos 1991). Chameleons differ from other arboreal lizards in having highly prehensile tails and zygodactylus feet allowing them to securely hold on to tree and shrub branches. This ability to grasp branches allows them to move about in arboreal habitats even though their center of gravity is high. In saxicolous species, a flat body could also allow them to find refuge in rock cracks and crevices (Vitt 1981; Miles 1994; Revell et al. 2007; Goodman et al. 2009). Lizards with longer hindlegs spend more time in the open away from cover and can run faster than lizards with shorter legs (Pianka 1969, 1986). Active foragers have longer tails and more slender builds than ambush species. Fossorial species are elongate with reduced limbs and short tails. Even though generalizations about anatomy and performance may not apply to every lizard species (see for example Jaksić et al. 1980; Zaaf and Van Damme 2001), morphologies nonetheless reflect habitat use, diet and other ecological traits. Ecomorphological patterns therefore facilitate ecological predictions because anatomical data can serve as surrogates for ecological measurements. Morphological measures can often be estimated more objectively than ecological parameters. Morphometrics may represent average long-term responses to natural selection and hence may reflect environmental conditions better than direct measurements of immediate ecological conditions (Ricklefs et al. 1981). We use five major microhabitat categories, as follows: fossorial, terrestrial, arboreal, saxicolous (rock dwelling), and semiaquatic. Semi-fossorial and semiarboreal species were scored in two of the five categories. Eight continuous anatomical variables were analyzed: mean snout-vent length (SVL), average length of unbroken tail (TL), cubic root of body weight in grams (Wt), head length (HL), head width (HW), head depth (HD), foreleg length (FLL), and hindleg length (HLL). These eight variables are highly correlated (average r = 0.79). Because data on body thickness were incomplete, we used the cubic root of body weight as a proxy for body thickness. Lizards forage in two distinctly different ways (Pianka 1966; Huey and Pianka 1981; Perry 1999; Reilly et al. 2007), which strongly affect lizard diets (Vitt and Pianka 2005). In the “sit-and-wait” mode, a predator waits in one place until a moving prey comes by and then ambushes the prey; in the “widely foraging” mode, a lizard actively searches out its prey. The second strategy requires greater exposure and energy expenditure than the first. The success of the sit-and-wait tactic usually depends on one or more of three conditions: a fairly high prey density, high prey mobility, and low predator energy requirements. The widely foraging tactic also depends on prey density and mobility and on the predator’s energy needs, but here the distribution of prey in space and the predator’s searching abilities assume paramount importance. Whereas ambush foragers rely on crypsis to avoid predators, active foragers attract the attention of potential predators because they are constantly on the move, and therefore must be alert and rely on speed and agility for escape. Vitt and Congdon (1978) and Huey and Pianka (1981) discussed several correlates of these foraging modes. We included foraging mode as a component of the trophic niche dimension, scoring iguanians as sit-and-wait (SW), ambush predators and most anguimorphs, with the exception of Kalahari lacertids (some species forage by ambush) as widely foraging (WF) active predators. Geckos and herbivores plus a few other taxa were scored using both SW and WF as intermediate or mixed foragers. Prey categories. Volumetric dietary data were obtained from Vitt et al. (2003). To standardize the global dietary dataset, data were reduced to seven major functional categories based on prior studies, as follows: 1) ants, 2) termites, 3) arachnids, 4) large insects (beetles, bugs, roaches, and orthopterans), 5) insect larvae, pupae, and eggs, 6) vertebrates, and 7) plants. These seven categories represented more than 80% of the total volume consumed by each lizard species included in this study. Including three discrete foraging modes (ambush, active, intermediate), the trophic dimension thus consists of 9-10 variables, of which the seven prey categories are continuous variables. Lizard life histories are multifaceted and have received a great deal of attention (Tinkle et al. 1970; Dunham and Miles 1985; Dunham et al. 1988; Vitt 1992), most recently by Mesquita et al. (2015, 2016) and references therein. Here we consider the following nine female life history variables. 1. Clutch or litter size (CS), a continuous variable —Average number of eggs deposited or young produced at one time — in all anoles, some geckos and some gymnophthalmids CS is fixed at 1, in other geckos and gymnophthalmids CS is 2. Some anoles contain two eggs, one in each oviduct but deposit them at different times (below). 2. Relative Clutch Mass (RCM), a continuous variable — clutch or litter mass divided by total female mass including eggs and/or babies (Andrews and Rand 1974; Vitt and Price 1982). 3. Clutch frequency — few data exist for most species, so we use reasonable categories based on what we see in the lizards. For example, if a female anole has two oviductal eggs (different stages) and two enlarged ovarian follicles (different size, but vitellogenic), then 4 clutches is a minimal estimate. Our discrete categories are therefore: 1, 2, 3, and 4 with the proviso that these are minimal estimates. Clutch frequency is difficult to estimate, and accurate data can only be derived from capture-recapture studies (Tinkle 1969). Because our data are based on necropsies of lizards collected for ecological studies, we base our estimates of clutch frequency on whether individuals contain evidence of one, two, three, four or more clutches/litters. A few species are biennial, and thus produce less than one clutch per year. Lizards in temperate zones have restricted breeding seasons (temperature and season length are major limiting factors) and produce one or two clutches/litters per year as a consequence. Lizards in tropical regions experience extended breeding seasons (thermally) but may be limited by wet-dry seasonality, although wet-dry seasonality may affect lizard species in the same habitat quite differently (James and Shine 1985; Vitt 1992). Within tropical lizard populations, necropsy estimates of clutch frequency can vary considerably. Tropical anoles provide a good example, with individuals showing evidence of as few as one clutch (single oviductal egg or enlarged follicle) to as many as four (allochronic ovulation limiting clutch size to one egg; an individual female can contain a vitellogenic follicle in each ovary of different sizes as well as an egg in each oviduct, but in different stages of shell development, thus indicating at least four clutches). To minimize under-estimation of clutch frequency, we use the maximum number of possible clutches based on our necropsy data. Thus, in a population of anoles, for example, even though many females might show evidence of only two or three clutches, if several individuals showed evidence of four clutches, then we estimate the number of clutches to be four or more. Although this categorization likely underestimates the number of clutches for many tropical species (e.g., some Anolis can produce an egg as frequently as every seven days; Andrews 1985), it provides a realistic conservative estimate of the number of clutches per season. Consequently, we assigned lizard species to one of the following five categories: 0.5— less than 1 clutch/litter per year (biennial); 1— 1 clutch/litter per year; 2— 2 clutches per year; 3— 3 clutches per year; 4— 4 or more clutches per year 4. Offspring size (SVL) — investment per progeny (continuous variable). 5. Female SVL at maturity (continuous variable). 6. Parity mode (oviparous or viviparous), discrete variable. 7. Mean snout-vent length of adult females (continuous variable). 8. Mean weight of adult females (continuous variable). 9. Sexual vs. asexual (parthenogenetic), discrete variable. Huey and Slatkin (1976) identified the slope of the regression of active body temperature on ambient temperature as a measure of the degree to which a given lizard species is a thermoconformer versus a thermoregulator. For any given species, a regression of body temperatures on ambient temperatures produces an equation for a least squares straight line that best fits the data. Pianka (1986, 1993) suggested that the slope/intercept of these regressions are measures of microhabitat and time of activity and, as such, represent useful surrogates that inform us about a lizard’s ecology. The slope of such regressions can be used as a unidimensional indicator of time and place of activity. Most, but not all, diurnal lizards tend to be thermoregulators and nocturnal species are thermoconformers, however, all degrees of intermediate thermoregulatory tactics also are observed and some tropical forest-dwelling diurnal lizards are thermoconformers. We compiled additional data for mean ambient air or substrate temperature and active body temperature, making a total of four continuous variables. Three discrete variables based on diel time of activity (diurnal, crepuscular, or nocturnal) were also included in this niche dimension. Species with crepuscular times of activity were scored in both the diurnal and nocturnal columns. Many lizard species, especially ambush foragers, rely on crypsis to evade detection. Crypsis can take many forms, including background matching associated with coloration and/or pattern, and lack of movement. Others, such as active foragers, attract attention because of constant motion, and therefore must remain alert and wary, relying mostly on speed and agility to escape predator attacks (Huey and Pianka 1981). Many, but not all, lizard species can shed their tail in a process known as autotomy (Arnold 1984; Zani 1996). Some lizard species have osteoderms in their scales (Strahm and Schwartz 1977), whereas others protect themselves with spines (Wiens and Reeder 1997). Some unique defense strategies were also included: Australian Strophurus geckos squirt noxious sticky mucous from glands in their tails (Rosenburg and Russell 1980). Liolaemus lutzae feign death (thanatosis) when captured (Rocha 1993), and the Pygopodid Delma butleri leaps energetically when disturbed (saltation; Bauer 1986; Turner 2007). We recognize the following 14 discrete defensive variables: Armor (including osteoderms), Crypsis, Color change, Tail Colors, Mimicry, Saltation, Thanatosis, Autotomy, Spines, Mucous, Bite, Flee, Threat, Venom, all of which are discrete variables. In summary, variables included in each of the five dimensional datasets were as follows (numbers in parentheses are the total number of niche variables in a given dimension. Some are ranges because we used double scoring to represent semi-arboreal, semi-fossorial, crepuscular, and mixed foraging categories). Raw data used in these analyses are given in the Appendix I. Habitat (13-15): We recognize five discrete microhabitat categories, as follows: fossorial, terrestrial, arboreal, saxicolous (rock dwelling), and semiaquatic. Semi-fossorial and semiarboreal species were scored in two categories, making a total of seven discrete variables. Eight continuous anatomical variables included mean snout-vent length (SVL), average length of unbroken tail (TL), cubic root transform of body weight (Wt), head length (HL), width (HW), and depth (HD), foreleg length (FLL), and hindleg length (HLL). Trophic (9-10): Foraging mode (three discrete variables) and proportional representation of seven prey categories by volume (seven continuous variables). Life history (9), are mixed and include both discrete and continuous variables, including adult female SVL and weight, clutch or litter size, relative clutch mass, clutch frequency, progeny size, parity mode (oviparous or viviparous), RCM and parthenogenesis. Metabolism (6-7): Thermoregulation (mean air and body temperatures of active lizards and the slope and intercept of regressions of active body temperature on ambient temperature, all continuous variables). We also include diurnal vs. nocturnal as well as crepuscular time of activity (discrete variables). Defensive Tactics (14), including armor, crypsis, tail autotomy, spiny body armor, color change, tail colors, mimicry, saltation, thanatosis, mucous, bite, flee, threat, and venom, all of which are discrete variables. Each of the five datasets was analyzed using Principal Coordinates Analysis (PCoA) based on Gower distances to derive dominant niche gradients for each dimension. The 24 variables that scale as real numbers on a continuum (e.g., SVL) were log transformed and standardized by z-transformation. Thirty other variables are discrete and scale as cardinal (e.g., clutch frequency) or ordinal (e.g., parity) numbers. With such a mixture of variables, Euclidean distances and standard PCA could not be used. Therefore, for each dataset we calculated Gower (1966) distances using the R package cluster (Suzuki and Shimodaira 2006), and then performed a Principal Coordinates Analysis (PCoA) using the package vegan (Oksanen et al. 2016 for R (R Core Team, 2016). Then a standard Principal Components Analysis (PCA) was performed to ordinate species within continuous niche space using species scores on the first three components from each of the five PCoAs. Following the methodology of Winemiller et al. (2015), species scores on the first three components from each of the five PCoAs were used as response variables in a regression tree analysis to generate a discrete niche classification for each dimension. We used the package rpart to make regression trees (Therneau et al. 2015) and pruned trees conservatively using the 1-SE rule. Results for each dimension were then combined to create a discrete classification based on all dimensions. When evaluating niche convergence based on regression tree results, one must bear in mind that convergence is always relative (i.e., relative to the original sets of independent variables compiled, relative to the precision and accuracy of measurements of those variables, relative to the criteria selected for doing the regression tree analysis, and relative to the criterion for claiming convergence vs. non-convergence). Regression tree analysis assigns each species a category on each niche dimension and allows one to identify matches that correspond to species assigned the same category. This method organizes variation in gradient space defined by trait combinations into a discrete classification system and an additional means to identify similar species. Species can match in one, two, three, four or five niche dimensions. For a conservative criterion to infer niche similarity, we identified those pairs of species that matched in four or five of the dimensions. Species belonging to the same clade and faunal continent that matched according to this criterion were considered cases of niche conservatism. Matches among species belonging to distantly related taxa and different geographical units were considered examples of convergent evolution. This definition will overestimate occurrence of conservatism (unless members of families or genera never evolve similar niches from different ancestral character states). Of course, the possibility exists that members of families or genera could evolve similar niches independently, especially if the family or genus is widespread. To facilitate exploration of species relationships within the multidimensional niche hypervolume, we created a set of interactive, rotatable 3D plots that are available online at 3D Models. Using these 3D plots, a viewer can i) examine species ordination within the space defined by the first three axes from the PCA that was done using the PCoA scores as input, ii) highlight some convergent species pairs of ecological equivalents, iii) view five natural trait group dichotomies, and iv) examine species’ positions in 3D niche space by geographic region of origin. PCoA ordination plots for each of the five dimensional datasets also can be explored separately using data in Appendix I. We tested if the number of species pairs found using regression tree analysis was significantly different than expected by chance. A null model was developed, where species were randomly assigned to niche dimensions from a uniform distribution in 1000 randomizations. Pairs of species matching in four or more niche dimensions were extracted for each run, and the resulting distribution of random pairs was then contrasted to the observed number of species pairs through a Wilcoxon test. The first PCoA axis for the habitat dimension accounted for 36.8 % of the variation in that dataset (axis 2 = 26.41 %, axis 3 = 11.5 %). Anatomical variables were highly intercorrelated (mean r = 0.79) and defined gradients along groups of species defined by habitat. For the trophic dimension, the first PCoA axis modeled 43.16 % of the variation (first 3 axes captured 68.97 % of total variation). Three groups of species formed along this axis according to foraging mode. The first two PCoAs of the life history dimension captured 62.69 % of variation, grouping species mainly by clutch frequency and clutch size. The third axis was associated with reproductive mode. The first axis from the PCoA of the metabolic dimension dataset accounted for 74.79 % of total variation (axis 2 = 9.91 %, axis 3 = 4.77 %). Species grouped mainly by diel activity. Diurnal species are arranged along a thermoregulator/thermoconformer gradient. For variables associated with defensive tactics, the first two axes from PCoA captured 55.58 % of the variation in the dataset (Table 1). Species relying on passive defensive methods such as crypsis and color change are opposed to those that actively escape by fleeing. Also, species with caudal autotomy were opposed to aggressive species that use threat and bite as main defensive tactics. PCA was performed using species loadings on the first three axes from each of the five PCoAs (Table 1). Species’ scores on the first two PCA axes were plotted to ordinate species within a continuous 2-dimensional ordination of lizard niches (Figure 2). The first axis is dominated by size and foraging mode whereas the second corresponds to terrestrial versus arboreal microhabitat. The third axis (Fig. 3) represents diurnal versus nocturnal time of activity and captures 15.49 % more of the variance for a total of 61.71 %. 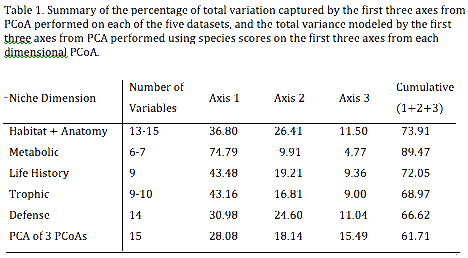
Lizard niches reveal a marked diurnal-nocturnal separation, which is largely associated with thermal strategies of the metabolic niche dimension. Considerable diversity in trophic, life history, defense and habitat strategies was observed within both diurnal and nocturnal lizards. Niche conservatism is observed when closely related species have similar niches, whereas convergence has occurred when species from different clades have similar niches. Widespread niche conservatism is evidenced by numerous phylogenetic clusters within niche space; i.e., many closely related species are clustered within a restricted region of lizard niche ordination space (derived from PCA) that represents continuous niche variation (Figures 2, 3). Niche conservatism also is evident when species from the same lineage match for categories in 4 or 5 of the niche dimensions according to the discrete niche representation derived from regression tree analysis (Figure 4). Based on this admittedly subjective criterion for matching, 103 pairs represent niche conservatisms out of the 8,911 possible species pairings. Figure 4. Prevalence of conservatism and convergence in the studied lizards in a phylogenetic and geographic context. Lizard species are color coded by geographic regions (black =Africa, red = Australia, blue = North America, green = South America). Niche conservatisms within clades are connected by black curves on the left of species names and niche convergences between clades are connected by green curves on the right (Figure by Nicolas Pelegrin). We also found ample evidence of niche convergence (Figure 4). Pairs of distantly related species are tightly clustered within the continuous niche space defined by the three major gradients derived from PCA (Figures 2, 3, 3D models; as one rotates the cloud of species in 3D space, they stay together). Some of these are obvious like Chameleo + Polychrus, Moloch + Phrynosoma and Varanus + Tupinambis, but others are less apparent (e.g. Australian Varanus eremius and North American Gambelia wislizeni). Convergence was also detected in the discrete niche representation derived from regression tree analysis. Of the 8,911 possible species pairs, regression tree analysis identified 100 convergences, when the criterion for convergence was matching of categories for at least 4 of the 5 niche dimensions (Figure 4). This is significantly greater than the combined number of matched pairs expected when species are randomly assigned niche categories from a uniform distribution (Wilcoxon Rank Sum Test; W = 328; P = 0.04). Of course, convergence of phenotypes and niches is never all or none, and varying degrees of convergence exist (Winemiller et al. 2015). Consequently, our criterion for recognizing species convergence according to the discrete niche scheme is necessarily subjective. First, the number of niche dimensions for which species must have matching categories was chosen subjectively (i.e., we could have relaxed this criterion by requiring as few as three dimensions to match, which would have yielded more cases of convergence but also potential mismatches). The resolution chosen for criteria used in regression tree analysis is subjective (we could have chosen a finer resolution that would have yielded fewer matched species pairs). Applicability of the periodic table of niches concept and choice of continuous vs. discrete methods of representation and data analysis will depend on the nature of the research problem being addressed or intended research application (for further discussion, see Winemiller et al. 2015). The African Chamaeleo and South American Polychrus are strongly convergent. These distantly related species both move slowly and have prehensile tails and eyes that move independently, two traits not included in our dataset. Although Moloch and Phrynosoma are distantly related and found on different continents, both are ant specialists that defend themselves with spines and cryptic coloration. The Australian pygmy monitor Varanus eremius and the North American crotaphytid Gambelia wislizeni are ecological equivalents that prey on smaller lizards. The widely foraging Kalahari lacertid Nucras tessellata and the North American teiid Aspidoscelis tigris are convergent with the South American teiid Teius oculatus. The Kalahari terrestrial skink Trachylepis occidentalis has converged on the niche occupied by several widely foraging Australian Ctenotus skinks. The widely foraging Kalahari lacertid Heliobolus lugubris has also converged on the niche space occupied by Australian Ctenotus skinks. Many ambush foragers also exhibit convergence: in South America, Gonatodes geckos are convergent with South American dactyloid anoles. A diurnal arboreal South American gecko Lygodactylus kugei is convergent with the dactyloid Anolis humilis, although a key difference is that L. klugei occurs in open tropical habitats whereas A. humilis occurs in lowland tropical forest. The sit-and-wait terrestrial diurnal Kalahari lacertids Meroles suborbitalis and Pedioplanis lineoocellata are convergent with the North American phrynosomatid Uta stansburiana and the Australian agamid Ctenophorus isolepis. The large Australian agamid Pogona minor is ecologically equivalent to the Kalahari agamid Agama aculeata. The herbivorous North American iguanid Dipsosaurus dorsalis is an ecological counterpart to the Australian agamid Ctenophorus nuchalis (Pianka 1971). Lizard niches are evolutionarily constrained due to phylogenetic relatedness as well as by tradeoffs between foraging mode and reproductive tactics. Position on a thermoregulatory-thermoconformer axis and anatomy are useful surrogates for habitat and microhabitat. Natural dichotomies, such as diel activity patterns and parity modes, also separate species. Evidence of niche convergence between distantly related species belonging to different clades living on different continents (teiids vs. lacertids and/or agamids vs. phrynosomatids) support the idea that a niche scheme exhibits periodicity – in other words, certain functional trait combinations are repeated across divergent clades and regional faunas, presumably as legacies of similar selection regimes, past and present. Tropical species are scattered throughout the niche hypervolume—not surprising considering their ecological and taxonomic diversity, which is likely driven by a combination of a warm climate and high habitat structural diversity. Interestingly, a large number of species from at least four divergent clades line up along the metabolic and anatomical axes. This further illustrates the value of a periodic niche scheme, in this case the ordination plot that allows species placement along continua —species from different clades and continents often cluster tightly together along certain gradients within niche space. If it were the case that patterns of functional trait variation arranged species strictly according to their phylogenetic relationships, then a niche scheme would be redundant with phylogeny and of little use. However, this clearly is not the case, at least for lizards. For example, anoles and geckos cluster along a gradient strongly influenced by life history, metabolic and defense dimensions, involving traits such as low clutch size, crypsis, and autotomy. However, these two groups are completely separated on the diel time-of-activity axis. Temperature drives the diurnal-nocturnal separation. Although phylogenetic clustering in niche space (niche conservatism) is quite evident, within each cluster are species from other families, ecological analogs that arose via convergent evolution. One interpretation for these patterns is that sets of ecological traits that promoted fitness under historical environmental conditions drove diversification within the clade, and extant species possess traits that reflect that legacy, but with certain species having evolved into new regions of trait/niche space in new settings. Within each clade, some species diverged to take advantage of specific high abundance resources (e.g., ants) producing ecological equivalents from deeply divergent clades (e.g., Phrynosoma and Moloch). These results support the notion that a set of potential niches exists, in effect a periodic table of lizard niches, but not all of these will be occupied within a given locality or region due to historical contingency. 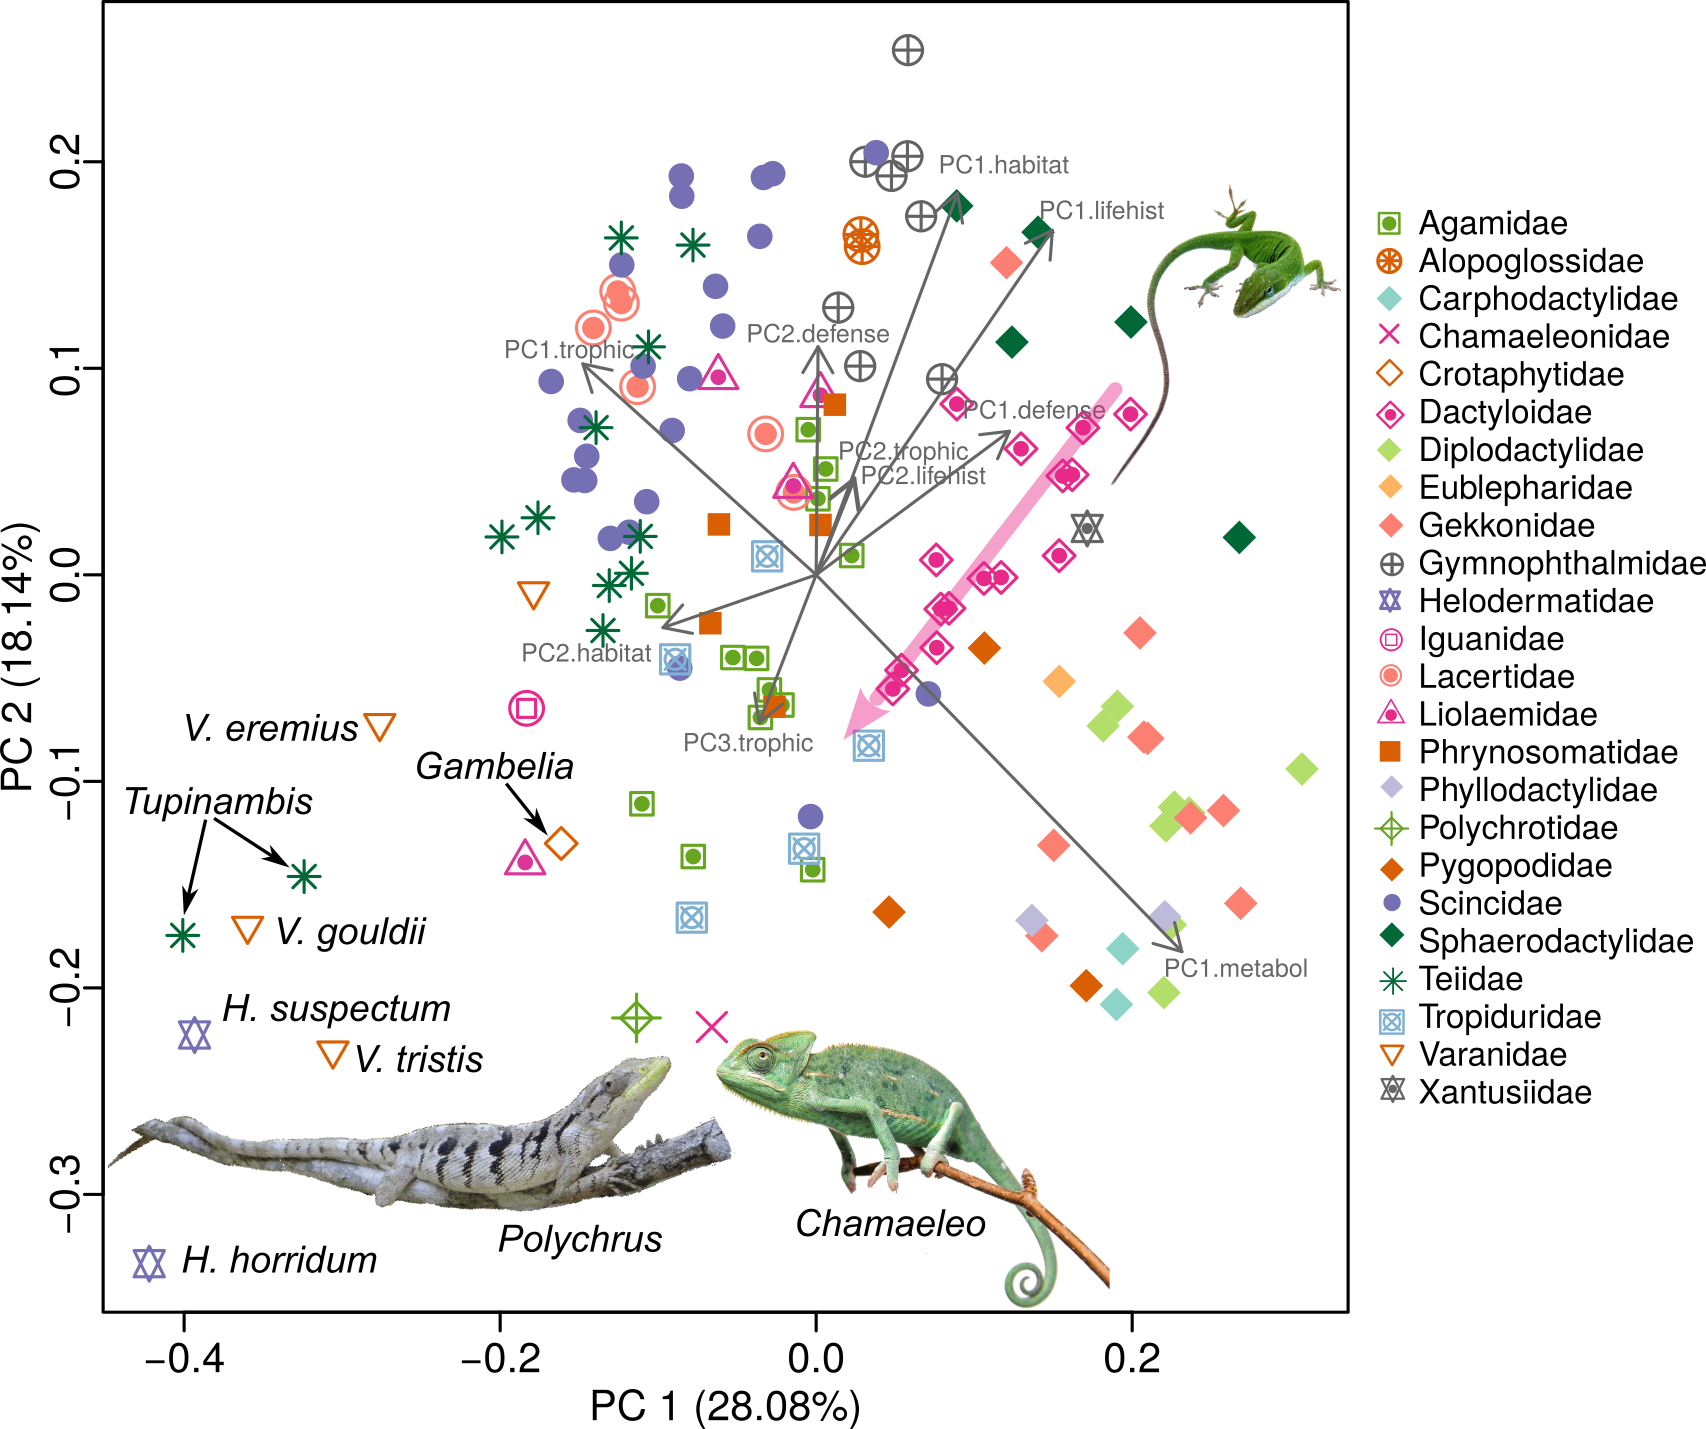
A new “giant” chameleon-like anole Anolis landestoyi from Hispaniola was recently described (Mahler et al. 2016). We can speculate where it would fall in our 3D plot of lizard niche space — dactyloids (anoles) are well represented in our dataset (15 species), filling a cylindrical ellipsoid whose longer axis is oriented towards the position of Polychrus and Chamaeleo — this new anole species likely will lie at the end of the ellipsoid facing them near the head of the pink arrow in Figure 5. Scores could be generated for its position in the 50+ hypervolume. The specificity of this prediction reveals the utility of a periodic niche scheme. One could have postulated that such a lizard might exist even before the species was discovered. Polychrus is sister to a large iguanian group containing dactyloids and was once classified as a polychrotid along with anoles but later was assigned to its own subfamily Polychrotinae (Conrad et al. 2007). Whereas all dactyloids have small clutches of only 1 egg, Polychrus have large clutches (mean CS for Polychrus acutirostris is 11.5 in our sample). Ecologists have argued for and against the concept of “empty niches” (Walker and Valentine 1984; Grime 2002). The periodic table scheme can be exploited to ask what ecological attributes and traits occupants of hypothetical niches would have to possess. For example, why do there seem to be no widely foraging, nocturnal arboreal lizards? Many geckos are arboreal and nocturnal indicating that insect foods are available, but they do not appear to forage widely. All skinks are active foragers, but most require high body temperature. Some Australian desert skinks (Eremiascincus, Liopholis) have evolved nocturnality, even including elliptical eye pupils, but all have remained terrestrial. Diurnal arboreal skinks occur in both Australia (Cryptobleparus) and the Kalahari (Trachylepis), but none have become nocturnal. Perhaps, in other parts of the world arboreal nocturnal skinks could exist. Rotating 3D plots is an effective way to explore constraints and tradeoffs in the evolution of lizard niches. Rotation in 3D space facilitates visualization of the manner in which species overlap or separate based on habitat, size, foraging mode, diet, life history, metabolism, and/or time and place of activity. Given that it is not possible to view a five-way rendition of space (only a three-way graph is feasible), we believe that 3D rotatable plots are the most effective way of revealing species niche relationships within a continuous niche hypervolume. Over 60% of the overall variance in 50+ niche dimensions can be captured in just three dimensions, suggesting that lizard niches are tightly constrained. Our 3D plots also suggest that empty niche space exists. However, this could be an artefact of incomplete taxon sampling given that our dataset includes only a fraction of global lizard diversity. Moreover, areas within the total lizard niche space perceived to be empty could be occupied by other terrestrial vertebrates. Other questions could be explored. The phenomenon of "gaps or holes in niche hypervolumes" could be examined (Blonder 2016). How evenly distributed are species distributed in niche space? Do they fill it up with few gaps, or are there regions of clustering? How do species positions in niche space vary in space and time? Gaps in niche space should be expected partly because of the temporal nature of species' existence. For example, apparent gaps may have been filled in the past or could be in the future. In theory, the only way all (or at least most) gaps could be filled (all niches occupied) would be if all species coexisted concurrently. To summarize, our study 1) proposed key components of lizard niches and compiled data for 134 species, 2) produced a niche ordination scheme, 3) revealed major niche dimensional gradients within total niche space and patterns of species ordination along these gradients and within the space defined by them, 4) demonstrated that niche diversification appears to have occurred differently among geographical areas, 5) revealed that some lineages exhibit high niche diversity whereas others do not, and 6) detected 100 convergences. These findings reinforce the utility of the periodic niche scheme proposed by Winemiller et al. (2015) and further developed herein. Niche conservatism was evident within most clades, even though cases of extreme niche convergence were identified and niche convergence was significantly greater than expected by chance. Considering our relatively low taxon sampling, many more convergences would be expected as additional data are collected. Combining our results for lizards with Winemiller et al.’s (2015) results for fishes, we suggest that construction of periodic niche schemes for other organisms could provide insights into when and how adaptive radiations of different groups of organisms occurred. Finally, our study reinforces MacArthur’s (1972) prediction that . . . "there will be a two- or three-way classification of organisms and their geometrical and temporal environments . . ." In the real world, niches are dynamic entities, constantly changing over evolutionary time as well as on shorter ecological time scales in response to changing demographics and abiotic and biotic environmental conditions. Here we have treated niches in an oversimplified way as being static – as mere points in a hypervolume fixed in time and space. Whereas lizards from 24 families and four continents are included in this analysis, only 2.2% of the known described species of lizards are represented. Our study includes almost all species with available data on morphology, habitat use, diet, life history, thermoregulation, and defense mechanisms – a reminder of how badly more field research is needed to provide empirical data to expand data matrices to produce niche schemes for testing ecological questions. Although our dataset may seem small for this initial undertaking, it nonetheless included multiple species from eight major clades (agamids, dactyloids, gekkota, gymnopthalmids, lacertids, phrynosomatids, skinks, and teiids). Missing are species from the rich lizard fauna of Southeast Asia (Das 2010; Grismer 2011), which, if included would undoubtedly yield many niche convergences with Neotropical lizards. As more ecological data with better geographic and taxonomic coverage are gathered and published, this analysis should be expanded to construct a more complete niche scheme and assessment of periodicity. With a more comprehensive dataset, many interesting questions could be addressed. For example, the 3D niche spaces occupied by various clades could be quantified as ellipsoids and compared. Anoles fall within a compact, cylindrical volume that reflects their niche conservatism, whereas other groups, such as phrynosomatids and skinks, are distributed within larger ellipsoids. Clades that dominate in different parts of the world reveal extensive convergences, such as New World teiids vs. Old World lacertids or Old World agamids vs. New World phrynosomatids, should have broadly overlapping ellipsoids. Estimates of clade niche breadth and overlap will be informative. As more periodic tables are created, comparative analyses among more distantly related clades (fish-frogs-salamanders-lizards-snakes-birds-mammals) will become possible, ultimately leading to a wider understanding of niche evolution among vertebrates. Robert MacArthur first proposed the concept of a periodic table of lizard niches to ERP at Princeton in 1965. Constructing such a niche scheme has been a long-term goal for half a century but has taken this long to come to fruition. ERP has been supported by the National Geographic Society and the Denton A. Cooley Centennial Professorship in Zoology at the University of Texas at Austin. LJV acknowledges support from the University of Oklahoma Research Council via a George Lynn Cross Research Professorship. NP was supported by a postdoctoral funded by CONICET, Argentina. DBF and KOW acknowledge support from NSF DEB 1257813 and NSF IGERT 065453377. We thank Daniel Beck for sharing his information on body temperatures of Heloderma, which allowed us to include this family of lizards in our analysis. We also thank Felix B. Cruz for sharing unpublished information on diet for L. chacoensis, Juan Carlos Acosta and Graciela Mirta Blanco for letting us use their unpublished data on Liolaemus lizards from Argentina and Martha Ramirez Pinilla for sharing data on Gymnophthalmids from Colombia. Virginia Abdala kindly helped us to gather information on Phymaturus. Suelem M. Leão collaborated in the conceptualization and aesthetics of figures. We thank editors of The American Naturalist Judith Bronstein and Edmund Brodie as well as two anonymous reviewers for helping us greatly improve this effort. Andrews, R. M. 1985. Oviposition frequency of Anolis carolinensis. Copeia 1985:259-262. Andrews, R. and A. S. Rand. 1974. Reproductive effort in anoline lizards. Ecology 55:1317-1327. Arnold, E. N. 1984. Evolutionary aspects of tail shedding in lizards and their relatives. Journal of Natural History 18:127-169. Bauer, A.M., 1986. Saltation in the pygopodid lizard, Delma tincta. Journal of Herpetology, 20:462-463 Bennett, A. F., and K. A. Nagy. 1977. Energy expenditure in free-ranging lizards. Ecology 58:697-700. Blom, M.P., P. Horner, and C. Moritz. 2016. Convergence across a continent: adaptive diversification in a recent radiation of Australian lizards. In Proc. R. Soc. B 2016 Jun 15 (Vol. 283, No. 1832, p. 20160181). The Royal Society. Blonder, B. 2016. Do hypervolumes have holes? The American Naturalist 187:E93-E105. Brown, W. L. and E. O. Wilson. 1956. Character displacement. Systematic Zoology 5:49-64. Chase, J. M. and M. A. Leibold. 2003. Ecological niches: linking classical and contemporary approaches. University of Chicago Press. Colwell, R. K., and T. F. Rangel. 2009. Hutchinson's duality: the once and future niche. Proceedings of the National Academy of Sciences 106:19651-19658. Conrad, J. L., O. Rieppel, and L.Grande. 2007. A Green River (Eocene) polychrotid (Squamata: Reptilia) and a re-examination of iguanian systematics. Journal of Paleontology, 81:1365-1373. Cooper, W. E., Jr. 2007. Foraging modes as suites of coadapted movement traits. Journal of Zoology 272:45-56. Das, I. 2010. Reptiles of South-East Asia. New Holland Publishers (UK), Ltd. Duellman, W.E. and E. R. Pianka. 1990. Biogeography of nocturnal insectivores: historical events and ecological filters. Annual Review of Ecology and Systematics 21:57-68. Dunham, A. E. 1978. Food availability as a proximate factor influencing individual growth rates in the iguanid lizard Sceloporus merriami. Ecology. 59:770–778. Dunham, A. E., and D. B. Miles. 1985. Patterns of covariation in life history traits of squamate reptiles: The effects of size and phylogeny reconsidered. The American Naturalist. 126:231-257. Dunham, A. E., D. B. Miles, and D. N. Reznick. 1988. Life history patterns in squamate reptiles. Pp. 441–552. In: C. Gans and R. B. Huey (Eds.), Biology of the Reptilia. Volume 16. Ecology B. Defense and Life History. Vol. 16. A. R. Liss, New York. Edwards, S., A. Herrel, B. Vanhooydonck, G.J. Measey, and K.A. Tolley. 2016. Diving in head first: trade‐offs between phenotypic traits and sand‐diving predator escape strategy in Meroles desert lizards. Biological Journal of the Linnean Society 119.4:919-931. Edwards S, 2014. Convergence in morphology is preceded by convergence in performance in lizards. Chapter 5 in Kiernan MP (ed.) Lizards: Thermal Ecology, Genetic Diversity and Functional Role in Ecosystems. Nova Publishers, Hauppauge, NY, USA. Elton, C. S. 1927. Animal Ecology. Sidgwick & Jackson, London. Goodman, B. A., S. C. Hudson, J. L. Isaac, and L. Schwarzkopf. 2009. The evolution of body shape in response to habitat: is reproductive output reduced in flat lizards? Evolution 63:1279-1291. Goodyear, S. E. and E. R. Pianka. 2011. Spatial and temporal variation in diets of sympatric lizards (genus Ctenotus) in the Great Victoria Desert, Western Australia. J. Herpetology 45:265-271. Gower, J. C. 1966. Some distance properties of latent root and vector methods used in multivariate analysis. Biometrika 53:325-338. Grime, J. P. 2002. Declining plant diversity: empty niches or functional shifts?. Journal of Vegetation Science 13:457-460. Grinnell, J. 1917. The niche-relationships of the California Thrasher. The Auk 34:427-433. Grinnell, J. 1928. Presence and absence of animals. Univ. Calif. Chronicle 30: 429-450. (Reprinted in 1943 as Joseph Grinnell’s Philosophy of Nature. University of California Press, Berkeley, pp. 187-208.) Grismer, L. L. 2011. Lizards of Peninsular Malaysia, Singapore and their adjacent Archipelagos. Edition Chimaira, Frankfurt am Main, Germany. Holt R. D. 1996. Demographic constraints in evolution: towards unifying the evolutionary theories of senescence and niche conservatism. Evolutionary Ecology 10:1-1. Holt, R. D. 2009. Bringing the Hutchinsonian niche into the 21st century: ecological and evolutionary perspectives. Proceedings of the National Academy of Sciences 106:19659-19665. Huey, R. B. and E. R. Pianka. 1981. Ecological consequences of foraging mode. Ecology 62:991-999. Huey, R. B. and M. Slatkin. 1976. Costs and benefits of lizard thermoregulation. Quarterly Review of Biology 51:363-384. Huey, R. B., E. R. Pianka, and T. W. Schoener. 1983. Introduction (pp. 1-6) in R. B. Huey, E. R. Pianka, and T. W. Schoener (eds.) Lizard Ecology: Studies of a Model Organism. Harvard University Press. Hutchinson, G. E. 1957. Concluding remarks. Cold Spring Harbor Symp. Quant. Biol. 22:66-77. Hutchinson, G. E. 1959. Homage to Santa Rosalia, or why are there so many kinds of animals? The American Naturalist 93:145-159. Hutchinson G. E. 1978. An Introduction to Population Biology. Yale University Press, New Haven, Connecticut. Jaksić, F. M., H. Núnez, and F. P. Ojeda. 1980. Body proportions, microhabitat selection, and adaptive radiation of Liolaemus lizards in central Chile. Oecologia 45:178–181. James, C. D., and R. Shine. 1985. The seasonal timing of reproduction: A tropical-temperate comparison in Australian lizards. Oecologia 67:464–474. Kearney, M., S.J. Simpson, D. Raubenheimer, and B. Helmuth. 2010. Modelling the ecological niche from functional traits. Philos. Trans. R. Soc. B. 365:3469–3483 Losos, J. 2009. Lizards in an Evolutionary Tree: Ecology and Adaptive Radiation of Anoles. University of California Press. Luke, C. 1986. Convergent evolution of lizard toe fringes. Biological Journal of the Linnean Society 27:1-16. MacArthur, R. H. 1970. Species packing and competitive equilibrium for many species. Theoretical Population Biology 1:1-11. MacArthur, R. H. 1972. Coexistence of species. Pp. 253-259 in J. Benke, ed., Challenging Biological Problems. Oxford Univ. Press. MacArthur, R. H. and R. Levins. 1967. The limiting similarity, convergence, and divergence of coexisting species. The American Naturalist 101:377-385. Mahler, D.L., S. M. Lambert A. J. Geneva, J. Ng, S. B. Hedges, J. B. Losos, and R. E. Glor. 2016. Discovery of a Giant Chameleon-Like Lizard (Anolis) on Hispaniola and Its Significance to Understanding Replicated Adaptive Radiations. The American Naturalist 188:357-364. Margalef, R. 1968. Perspectives in ecological theory. University of Chicago Press. Mesquita, D. O., Colli, G. R., Costa, G. C., Costa, T. B., Shepard, D. B., Vitt, L. J. and Pianka, E. R. 2015. Life history data of lizards of the world. Ecology 96:594. Mesquita, D. O., R. G. Faria, G. R. Colli, L. J. Vitt, and E. R. Pianka. 2016. Lizard life-history strategies. Austral Ecology 41:1-5. Mesquita, D. O., G. C. Costa, R. Colli, T. B. Costa, D. B. Shepard, L. J. Vitt, and E. R. Pianka. 2016. Life history patterns of lizards of the world. The American Naturalist 187:689-705. Miles, D. B. 1994. Covariation between morphology and locomotory performance in sceloporine lizards. in Vitt, L. J. and E. R. Pianka (eds.), Lizard Ecology:Historical and Experimental Perspectives. Princeton University Press, Princeton. Oksanen, J., F. G. Blanchet, R. Kindt, P. Legendre, P. R. Minchin R. B. O’Hara G. L. Simpson, P. Solymos, M. H. Stevensand H. Wagner, 2016. vegan: Community Ecology Package. R package version 2.3-5. Perry, G. 1999. The evolution of search modes: ecological versus phylogenetic perspectives. The American Naturalist 153:98-109. Pianka, E. R. 1966. Convexity, desert lizards, and spatial heterogeneity. Ecology 47:1055-1059. Pianka, E. R. 1969. Sympatry of desert lizards (Ctenotus) in Western Australia. Ecology 50:1012-1030. Pianka, E. R. 1971. Comparative ecology of two lizards. Copeia 1971:129-138. Pianka, E. R. 1974. Evolutionary Ecology. First Edition. Harper and Row, New York. Pianka, E. R. 1976. Competition and niche theory. Chapter 7 (pp. 114-141) in R. M. May (ed.) Theoretical Ecology: Principles and Applications. Blackwell. Pianka, E. R. 1986. Ecology and Natural History of Desert Lizards. Analyses of the Ecological Niche and Community Structure. Princeton University Press, Princeton, New Jersey. Pianka, E. R. 1993. The many dimensions of a lizard's ecological niche. Chapter 9 (pp. 121-154) in E. D. Valakos, W. Bohme, V. Perez-Mellado, and P. Maragou (eds.) Lacertids of the Mediterranean Basin. Hellenic Zoological Society. University of Athens, Greece. Pough, F. H. 1980. The advantages of ectothermy for tetrapods. The American Naturalist 115: 92-112. Pounds, J. A. 1988. Ecomorphology, locomotion, and microhabitat structure:patterns in a tropical mainland Anolis community. Ecological Monographs 58:299-320. Pyron, R. A., and F. T. Burbrink. 2009. Body size as a primary determinant of ecomorphological diversification and the evolution of mimicry in the lampropeltinine snakes (Serpentes: Colubridae). Journal of Evolutionary Biology 22:2057-2067. R Core Team (2016). R: A language and environment for statistical computing. R Foundation for Statistical Computing, Vienna, Austria. URL https://www.R-project.org/. Reilly, S. M., L. D. McBrayer, and D. Miles, eds. 2007. Lizard Ecology: The Evolutionary Consequences of Foraging Mode. Cambridge University Press. Revell, L. J., M. A. Johnson, J. A. Schulte, J. J. Kolbe, and J. B. Losos. 2007. A phylogenetic test for adaptive convergence in rock-dwelling lizards. Evolution 61:2898–2912. Ricklefs, R. E., D. Cochran, and E. R. Pianka. 1981. A morphological analysis of the structure of communities of lizards in desert habitats. Ecology 62:1474-1483. Rosenberg, H. I., and A. P. Russell. 1980. Structural and functional aspects of tail squirting: a unique defense mechanism of Diplodactylus (Reptilia: Gekkonidae). Canadian Journal of Zoology 58:865-881. Schall, J. J. and E. R. Pianka. 1978. Geographical trends in numbers of species. Science 201:679-686. Schoener, T. W. 1977. Competition and the niche. Chapter 2 in C. Gans and D.W. Tinkle (eds.) Biology of the Reptilia 7:35-136. Shine, R., and L. Schwarzkopf. 1992. The evolution of reproductive effort in lizards and snakes. Evolution 46:62-75. Sinervo, B. and J. B. Losos. 1991. Walking the tight rope: arboreal sprint performance among Sceloporus occidentalis lizard populations. Ecology 72:1225-1233. Snyder, R. C. 1954. The anatomy and function of the pelvic girdle and hindlimb in lizard locomotion. American Journal of Anatomy 95:1-45. Steffen, W. L. 1996. A periodic table for ecology? A chemist's view of plant functional types. Journal of Vegetation Science 7:425-430. Strahm, M.H., and Schwartz, A. 1977. Osteoderms in the anguid lizard subfamily Diploglossinae and their taxonomic importance. Biotropica 1:58-72. Suzuki, R. and H. Shimodaira. 2006. Pvclust: an R package for assessing the uncertainty in hierarchical clustering. Bioinformatics 22:1540-2. Therneau, T., B. Atkinson, and B. Ripley. 2015. rpart: Recursive Partitioning and Regression Trees. R package version 4.1-10 Tinkle, D. W. 1969. The concept of reproductive effort and its relation to the evolution of life histories of lizards. The American Naturalist 103:501-516. Tinkle, D. W., H. M. Wilbur, and S. G. Tilley. 1970. Evolutionary strategies in lizard reproduction. Evolution. 24:55–74. Turner, G.S., 2007. Observations of Diurnal Activity in the Striped Legless Lizard 'Delma Impar'. The Victorian Naturalist 124:167. Uetz, P. 2016a. The Reptile Database. Numbers of Species. Uetz, P. 2016b. The Reptile Database. Higher Taxa. Van Damme, R., P. Aerts, and B. Vanhooydonck. 1997. No trade-off between sprinting and climbing in two populations of the Lizard Podarcis hispanica (Reptilia:Lacertidae). Biological Journal of the Linnean Society 60:493-503. Vanhooydonck, B., and R. Van Damme. 1999. Evolutionary relationships between body shape and habitat use in lacertid lizards. Evolutionary Ecology Research 1:785-805. Vitt, L. J. 1981. Lizard reproduction: habitat specificity and constraints on relative clutch mass. The American Naturalist 117:506-514. Vitt, L. J. 1992. Diversity of reproductive strategies among Brazilian lizards and snakes: the significance of lineage and adaptation. Pp. 135-149 in W. Hamlett (ed.), Reproductive Biology of South American Vertebrates. Springer-Verlag, New York. Vitt, L. J., and J. D. Congdon. 1978. Body shape, reproductive effort, and relative clutch mass in lizards: resolution of a paradox. The American Naturalist 112:595-608. Vitt, L. J. and E. R. Pianka (eds.) 1994. Lizard Ecology: Historical and Experimental Perspectives. Princeton University Press. Vitt, L. J. and E. R. Pianka. 2005. Deep history impacts present day ecology and biodiversity. Proc. Nat. Acad. Sci. 102:7877-7881. Vitt, L. J., and H. J. Price. 1982. Ecological and evolutionary determinants of relative clutch mass in lizards. Herpetologica 38:237–255. Vitt, L. J., E. R. Pianka, W. E. Cooper, Jr., and K. Schwenk. 2003. History and the global ecology of squamate reptiles. The American Naturalist 162:44-60. Walker, T.D. and Valentine, J.W., 1984. Equilibrium models of evolutionary species diversity and the number of empty niches. The American Naturalist 124:887-899. Wiens, J. J. and Reeder, T. W. 1997. Phylogeny of the spiny lizards (Sceloporus) based on molecular and morphological evidence. Herpetological Monographs 1997 Jan 1:1-101. Wiens, J. J., D. D. Ackerly, A. P. Allen, B. L. Anacker , L. B. Buckley, H. V. Cornell, E. I. Damschen, T. Jonathan Davies, J. A. Grytnes, S. P. Harrison, and B. A. Hawkins. 2010. Niche conservatism as an emerging principle in ecology and conservation biology. Ecology letters 13:1310-24. Williams, E. E. 1983. Ecomorphs, faunas, island size, and diverse end points in island radiations of Anolis. Pages 326–370 in R. B. Huey, E. R. Pianka, and T. W. Schoener, eds. Lizard ecology: studies of a model organism. Harvard University Press, Cambridge, MA. Williamson, M. H. 1972. The analysis of biological populations. London: Edward Arnold. Winemiller, K. O., D. B. Fitzgerald, L. Bower, and E. R. Pianka. 2015. Functional traits, convergent evolution, and periodic tables of niches. Ecology Letters 18:737–751. Zaaf, A., R. Van Damme, A. Herrel and P. Aerts. 2001. Spatio-temporal gait characteristics of level and vertical locomotion in a ground-dwelling and a climbing gecko. The Journal of Experimental Biology 204:1233–1246. Zani, P. A. 1996. Patterns of caudal‐autotomy evolution in lizards. Journal of Zoology 240: 201-220. |
|
References Blom, M.P., Horner, P., and Moritz, C. 2016. Convergence across a continent: adaptive diversification in a recent radiation of Australian lizards. In Proc. R. Soc. B 2016 Jun 15 (Vol. 283, No. 1832, p. 20160181). The Royal Society. Pianka, E. R. 1993. The many dimensions of a lizard's ecological niche. Chapter 9 (pp. 121-154) in E. D. Valakos, W. Bohme, V. Perez-Mellado, and P. Maragou (eds.) Lacertids of the Mediterranean Basin. Hellenic Zoological Society. University of Athens, Greece. Pianka, E. R. 1996. Long-term changes in Lizard Assemblages in the Great Victoria Desert: Dynamic Habitat Mosaics in Response to Wildfires. Chapter 8 (pp. 191-215) in M. L. Cody and J. A. Smallwood (eds.) Long-term studies of vertebrate communities. Academic Press. Mesquita, D. O., G. R. Colli, G. C. Costa, T. B. Costa, D. B. Shepard, L. J. Vitt, and E. R. Pianka. 2015. Life history data of lizards of the world. Ecology 96(2) 594. Ecological Archives E096-058. Download pdf Mesquita, D. O., R. G. Faria, G. R. Colli, L. J. Vitt, and E. R. Pianka. 2016. Lizard life history strategies. Austral Ecology 41: 1-5. Download pdf. Mesquita, D. O., G. C. Costa, R. Colli, T. B. Costa, D. B. Shepard, L. J. Vitt, and E. R. Pianka. 2016. Life history patterns of lizards of the world. The American Naturalist 187: 689-705. Download pdf Uetz, P. 2016a. The Reptile Database. Species Numbers (Link) Uetz, P. 2016b. The Reptile Database. Higher Taxa. (Link). Winemiller, K. O., D. Fitzgerald, L. Bower, and E. R. Pianka. 2015. Functional traits, convergent evolution, and periodic tables of niches. Ecology Letters 18(8): 737–751. Download pdf. Commentary |