|
With intermittent funding (much of it out of my own pocket) and the help of a small army of colleagues and assistants from 1962 through 2008, I have gathered and analyzed extensive data on ecological relationships of lizard faunas of some 32 desert study sites, which lie at roughly similar latitudes on three continents: western North America, southern Africa, and Western Australia. A series of 10-12 representative flatland desert areas were selected for investigation on each continent. Study sites are homogeneous and continuous, extensive enough to facilitate sampling, and generally well suited for ecological analyses. Study areas vary in size from about half a square kilometer to several square kilometers. Study sites exhibit a variety of habitat types, ranging from simple vegetation to more complex structure. Eleven of the 21 recognized families of extant lizards occur in these desert ecosystems. Five lizard families are represented in each continental desert-lizard system. Australian deserts have about 22 lizard genera and 62 species, African deserts 13 genera and 22 species, and North American deserts 12 genera and 12 species. In 1986, I published a synthesis "Ecology and Natural History of Desert Lizards" (Princeton Univ. Press) with extensive summaries of data collected from 1962-1979. Since then, I have been fortunate to collect many more data on Australian lizards (12,634 new specimens) from 3 study sites. Many of these species are uncommon but I have managed to acquire adequate sample sizes for most. Understanding the ecology of rare species constitutes a major challenge for ecologists (Main 1982; Thompson et al. 2003). Some North American study sites have succumbed to urbanization, making my 1960's records of substantial historical and scientific interest. Essentially they represent a recent fossil record of what was there before humans usurped the habitat. Humans are bent on erasing the very signature of the evolution of life on this Earth making it urgent that we read the vanishing book before it is destroyed -- of course, we must also do our utmost to save it for future generations to study. I often receive requests for raw data, but I can seldom provide them. These data were collected primarily to elucidate niche segregation and diversity, but many more innovative analyses should be undertaken. For example, we offered an informative analysis of how frequently lizards had empty stomachs (Huey et al. 2001). Another analysis used dietary niche breadths to test food web theory (Winemiller et al. 2001). Still another study demonstrated that deep history has had a profound impact on present day diets (Vitt and Pianka 2005). There is a great deal of interest in my huge unique data set, and if I were to die, other people would doubtlessly try to recover it, but this would be greatly facilitated if it could be done while I am still here to supervise and explain my data. My goal is to preserve for posterity as much information as possible for each individual lizard (about 28,000 of them!). These data need to be organized in a common current relational database format. This will require a computer-savvy senior research assistant who will learn to identify species and will be briefed on various data formats. This person will supervise undergraduate research assistants for several years (Budget) -- data will be collated, organized and cross checked. These data are in a wide variety of formats: of those that have been digitized, some are still simple text files, others are in MS Word or Excel format, while others are Cricket Graph and Statview files. These need to be copied, carefully merged, and entered into a relational database, and then cross-checked for accuracy. A substantial amount of dietary data on about 14,000 lizards have not yet been digitized but were analyzed and summarized by hand -- these must now be entered into digital computer files. Lizards collected are summarized in the following two tables.
Data acquired up until 1979 (first table) were summarized with totals and means as appendices in Pianka (1986), but will now be made available in much greater detail for each individual lizard. Ecology has changed dramatically in the past couple decades, with much greater emphasis now being placed on conservation biology, rare species, and phylogenetically corrected analyses of evolution using modern comparative methods. Whereas data collected before 1979 were intended for studying niche partitioning and community structure, data collected since 1989 using pit traps (second table, above) were designed to study rare species, fire succession, long-term change, habitat and microhabitat requirements, adaptive radiations, and phylogenetic constraints. Thus, these new data complement the older data and are qualitatively different than those collected earlier. These new data have not yet been published and will be organized and mined for new insights before they are put into the public domain and made freely available and easily accessible to all. Princeton University Press has expressed an interest in publishing a sequel to my 1986 book, with innovative new syntheses and a DVD of data files. The text below explains some of what will be on that DVD. Essentially, it will contain everything I know about each individual lizard, including locality and date of collection, time of activity, body and air temperature, snout-vent length (SVL), tail length plus tail condition, fresh body weight, 8 other head size and leg length morphometric variables, microhabitat location or pit trap number, sex, reproductive condition, and stomach contents. Auxillary supporting data on climate, snakes, birds, mammals, GPS coordinates of pit trap locations, high-resolution aerial photographs with precise pit trap locations plotted on them, and DNA sequences will also be included. These data should be useful to a wide variety of biologists, including conservation biologists, physiologists, and zoo biologists. In western North America, deserts form a continuous and enclosed series, uninterrupted by major physical barriers, over a latitudinal range of 1500 km, from southern Idaho and Oregon through Sonora and Baja California (Mexico). Three distinct regions are generally recognized within this region: a northern Great Basin Desert, a southern Sonoran Desert, and an intermediate area in southern California and southern Nevada known as the Mojave Desert. The Great Basin desert is structurally simple, with predominantly a single perennial plant life form (low "microphyllous semi-shrubs" including Atriplex confertifolia and Artemesia tridentata). Vertical heterogeneity is minimal. Because these small shrubs in northern deserts are usually very densely packed and uniformly spaced, horizontal spatial heterogeneity is also low. 
The Great Basin Desert is a very repetitive and rather monotonous landscape. In contrast, the Sonoran is an arboreal desert with several species of trees and, in addition to small semi-shrubs such as Atriplex, many large woody shrubs (the most conspicuous of which is creosote bush, Larrea divaricata). As a result, the vertical component of spatial heterogeneity is considerably greater than it is in the Great Basin Desert. The Mojave Desert is also dominated by Larrea, but is virtually treeless, except for a few Yucca brevifolia "trees." The diversity of different plant life forms reaches an apex in the Sonoran Desert. The addition of perennial plant life forms in southern U.S. deserts is often accompanied by fewer plant individuals per unit area and much greater horizontal heterogeneity in their distribution in space. Rivulets and dry washes along bajadas are lined with different species of plants than intervening areas. Saurofaunas in the flatland deserts of western North America consist of a basic "core" set of four ubiquitous species (the whiptail Aspidoscelis (formerly Cnemidophorus) tigris, the side-blotched lizard Uta stansburiana, the leopard lizard Gambelia wislizenii, and the desert horned lizard Phrynosoma platyrhinos) to which various combinations of other species are added, with the total number of species increasing from 4 or 5 in the north to 9-11 in the south (Pianka 1967). Three Great Basin areas were studied (areas I, L, and G), four sites were selected in the Mojave Desert (areas V, S, P and M), along with a further three Sonoran sites (areas T, W, and C). Incidental observations were also made at two Sonoran desert sites in northern Mexico (areas A and B). North American fieldwork was undertaken primarily during 1962 through 1964, but a few observations were also made in Mexico during the summers of 1966 and 1969. Some North American study sites have been encroached upon by urbanization and several no longer support any lizards (e.g., Mojave, 29 Palms and Casa Grande). All North American lizard specimens are lodged in the Los Angeles County Museum of Natural History. In the southern Kalahari, major physiognomic and vegetational changes take place along an east-west precipitation gradient: the more mesic eastern region consists of flat sandplains with a savanna-like vegetation, whereas stabilized sandridges characterize the drier western "sandveld" or "duneveld." These red sandridges, which average about 10 m in height, generally parallel the direction of prevailing winds; sandridges are frequently as long as a kilometer or even more and support a characteristic grassy dune vegetation. Interdunal flats or "streets" average about 250 m in width, but occasionally may be much more extensive, sometimes as wide as several km, with a vegetation consisting of various grasses, laced with large bushes and scattered small trees. Two common woody shrubs of Kalahari flats are Rhigozum trichotomum and Grewia flava, both of which are vaguely reminiscent of the North American Larrea divaricata. Detailed descriptions of Kalahari vegetation, with photographs, are provided by Leistner (1967). Ten study areas were selected representing the full range of habitats and conditions prevailing across the southern part of the Kalahari (Pianka 1971). 
delineated by Leistner. Positions of 10 study sites are shown Four eastern sites are all on fairly flat terrain, but vary in their vegetation: area G is a chenopod shrub desert with Atriplex semibaccata, area R is a nearly pure Rhigozum flat, whereas area D supports a more diverse mixture of small to large shrubs, including Rhigozum, Grewia, and the thorny bush Acacia mellifera. Area T, in southern Botswana, is a mixed open forest and savanna site with a substantial number of trees (this site was still quite wild at the time of our initial study in 1969-70 with Spotted Hyaena, but with the advent of bore water, it has since become cattle-grazing country); the savanna and forest sections of the T-area can be treated separately as sub-areas. Most Kalahari observations were made during the 1969-70 Austral season, supplemented on a second trip in 1975-76. Most Kalahari specimens are lodged in the Los Angeles County Museum of Natural History but the 1975-76 specimens are lodged in the Museum of Vertebrate Zoology at the University of California at Berkeley. Censuses of Kalahari lizards collected on each of these study sites were compiled. The Great Victoria Desert of Australia is also predominantly sandy with red sands, and supports a vegetation consisting mainly of so-called "spinifex" or "porcupine" grasses (genus Triodia) plus various species of gum trees (Eucalyptus). In wetter places and on harder soils, tracts of "mulga" (Acacia aneura) occur. Occasional dry lakebeds are inhabited largely by various shrubby chenopod species (including Atriplex lindleyi). Stabilized long red sandridges, parallel to prevailing winds and generally very much like those in the Kalahari, are scattered throughout the Great Victoria Desert, particularly in the eastern interior. Extensive areas of sandplain occur as well. The region is very heterogeneous and mixed habitats of shrubs, Triodia, Acacia, and Eucalyptus occur on desert loams. Study sites A and M are on such ecotonal mixed areas. "Red Sands" (area R) and area E are sandridge sites with marble gum trees (Eucalyptus gongylocarpa), a few desert bloodwood trees (Eucalyptus sp.), extensive spinifex (Triodia), and a variety of sandridge perennials. On area D, a few scattered smaller sandridges and sand dunes support a lower and more open vegetation with fewer trees. Sandplain habitats also occur on these three study sites between sandridges. Two other areas, G and L, consist solely of such flat or gently rolling sandplains, with large marble gum eucalypt trees, spinifex and some scattered bushes. Areas B and N are "pure" spinifex flats (treeless grass desert), whereas area Y is a relatively pure (nearly treeless) shrub desert site in a dry lakebed. The last site was chosen because the structure of its vegetation was comparable to that of North American Great Basin Desert areas as well as that of Kalahari area G. 
I continued to monitor the Australian saurofaunas at the L-area and Redsands during 1989-1991 when I set up extensive pit trap lines. In 1992-94, dual funding from NSF and NASA allowed me to undertake a detailed satellite imagery remote sensing study of wildfires as agents of disturbance promoting habitat diversity in the Great Victoria desert of Western Australia (Haydon et al. 2000a,b). An Australian field assistant was paid to run pit trap samples for 3 months during the Austral spring of 1992. A new study site, the B-area, with pit trap lines was set up and monitored before a controlled burn -- it was burned in October 1995 and I have continued to monitor it following the fire during 1995, 1998, 2003 and 2008 to assess changes in community structure. Fire is increasingly recognized as a major contributor to species density and ecology, but what is the length of the recovery phase for desert lizard communities? My long-term census data provide insights into how individual species respond (species composition, relative abundance, dietary flexibility, and reproductive tactics). A total of 2573 individual lizards representing some 45 species have been collected at the B-area from 1992 through 2008. Stomach contents of these lizards are being exploited to evaluate how arthropod prey resources change during the fire succession cycle after adjusting for historical constraints on lizard diets. I began studies at Red Sands in 1978-79 (N = 1436) under a Guggenheim Fellowship, continued them during 1989-92 (N = 3196) with support from the National Geographic Society and a Fulbright, and have made subsequent collections in 1995-96 (N = 2353), 1998 (N = 1272), 2003 (N = 895), and 2008 (N = 1075). Similarly, I have conducted censuses on the L-area in 1966-68 (N = 532), 1978-79 (N = 1567), and 1989-92 (N = 1997). These data will be used to study long-term changes (Pianka 1996) such as those that occur in response to fires and shrub encroachment due to increased precipitation (global weather modification). Lizard abundance and species richness both decreased from 1998 to 2008 as evidenced by sampling the exact same pits 3 times in ten years ranging from September-December 1998 to September-December 2003 and once again during September-December 2008. To gather data on ecological relationships of these lizard faunas, my assistants and I walked transects thousands of kilometers through study sites observing lizards. Between 1962 and 1979 we spent five full years in the field and nearly twelve man-years collecting data on lizards (sites were visited repeatedly over essentially the full seasonal period of lizard activity). Microhabitat and time of activity were recorded for most lizards encountered active above ground. 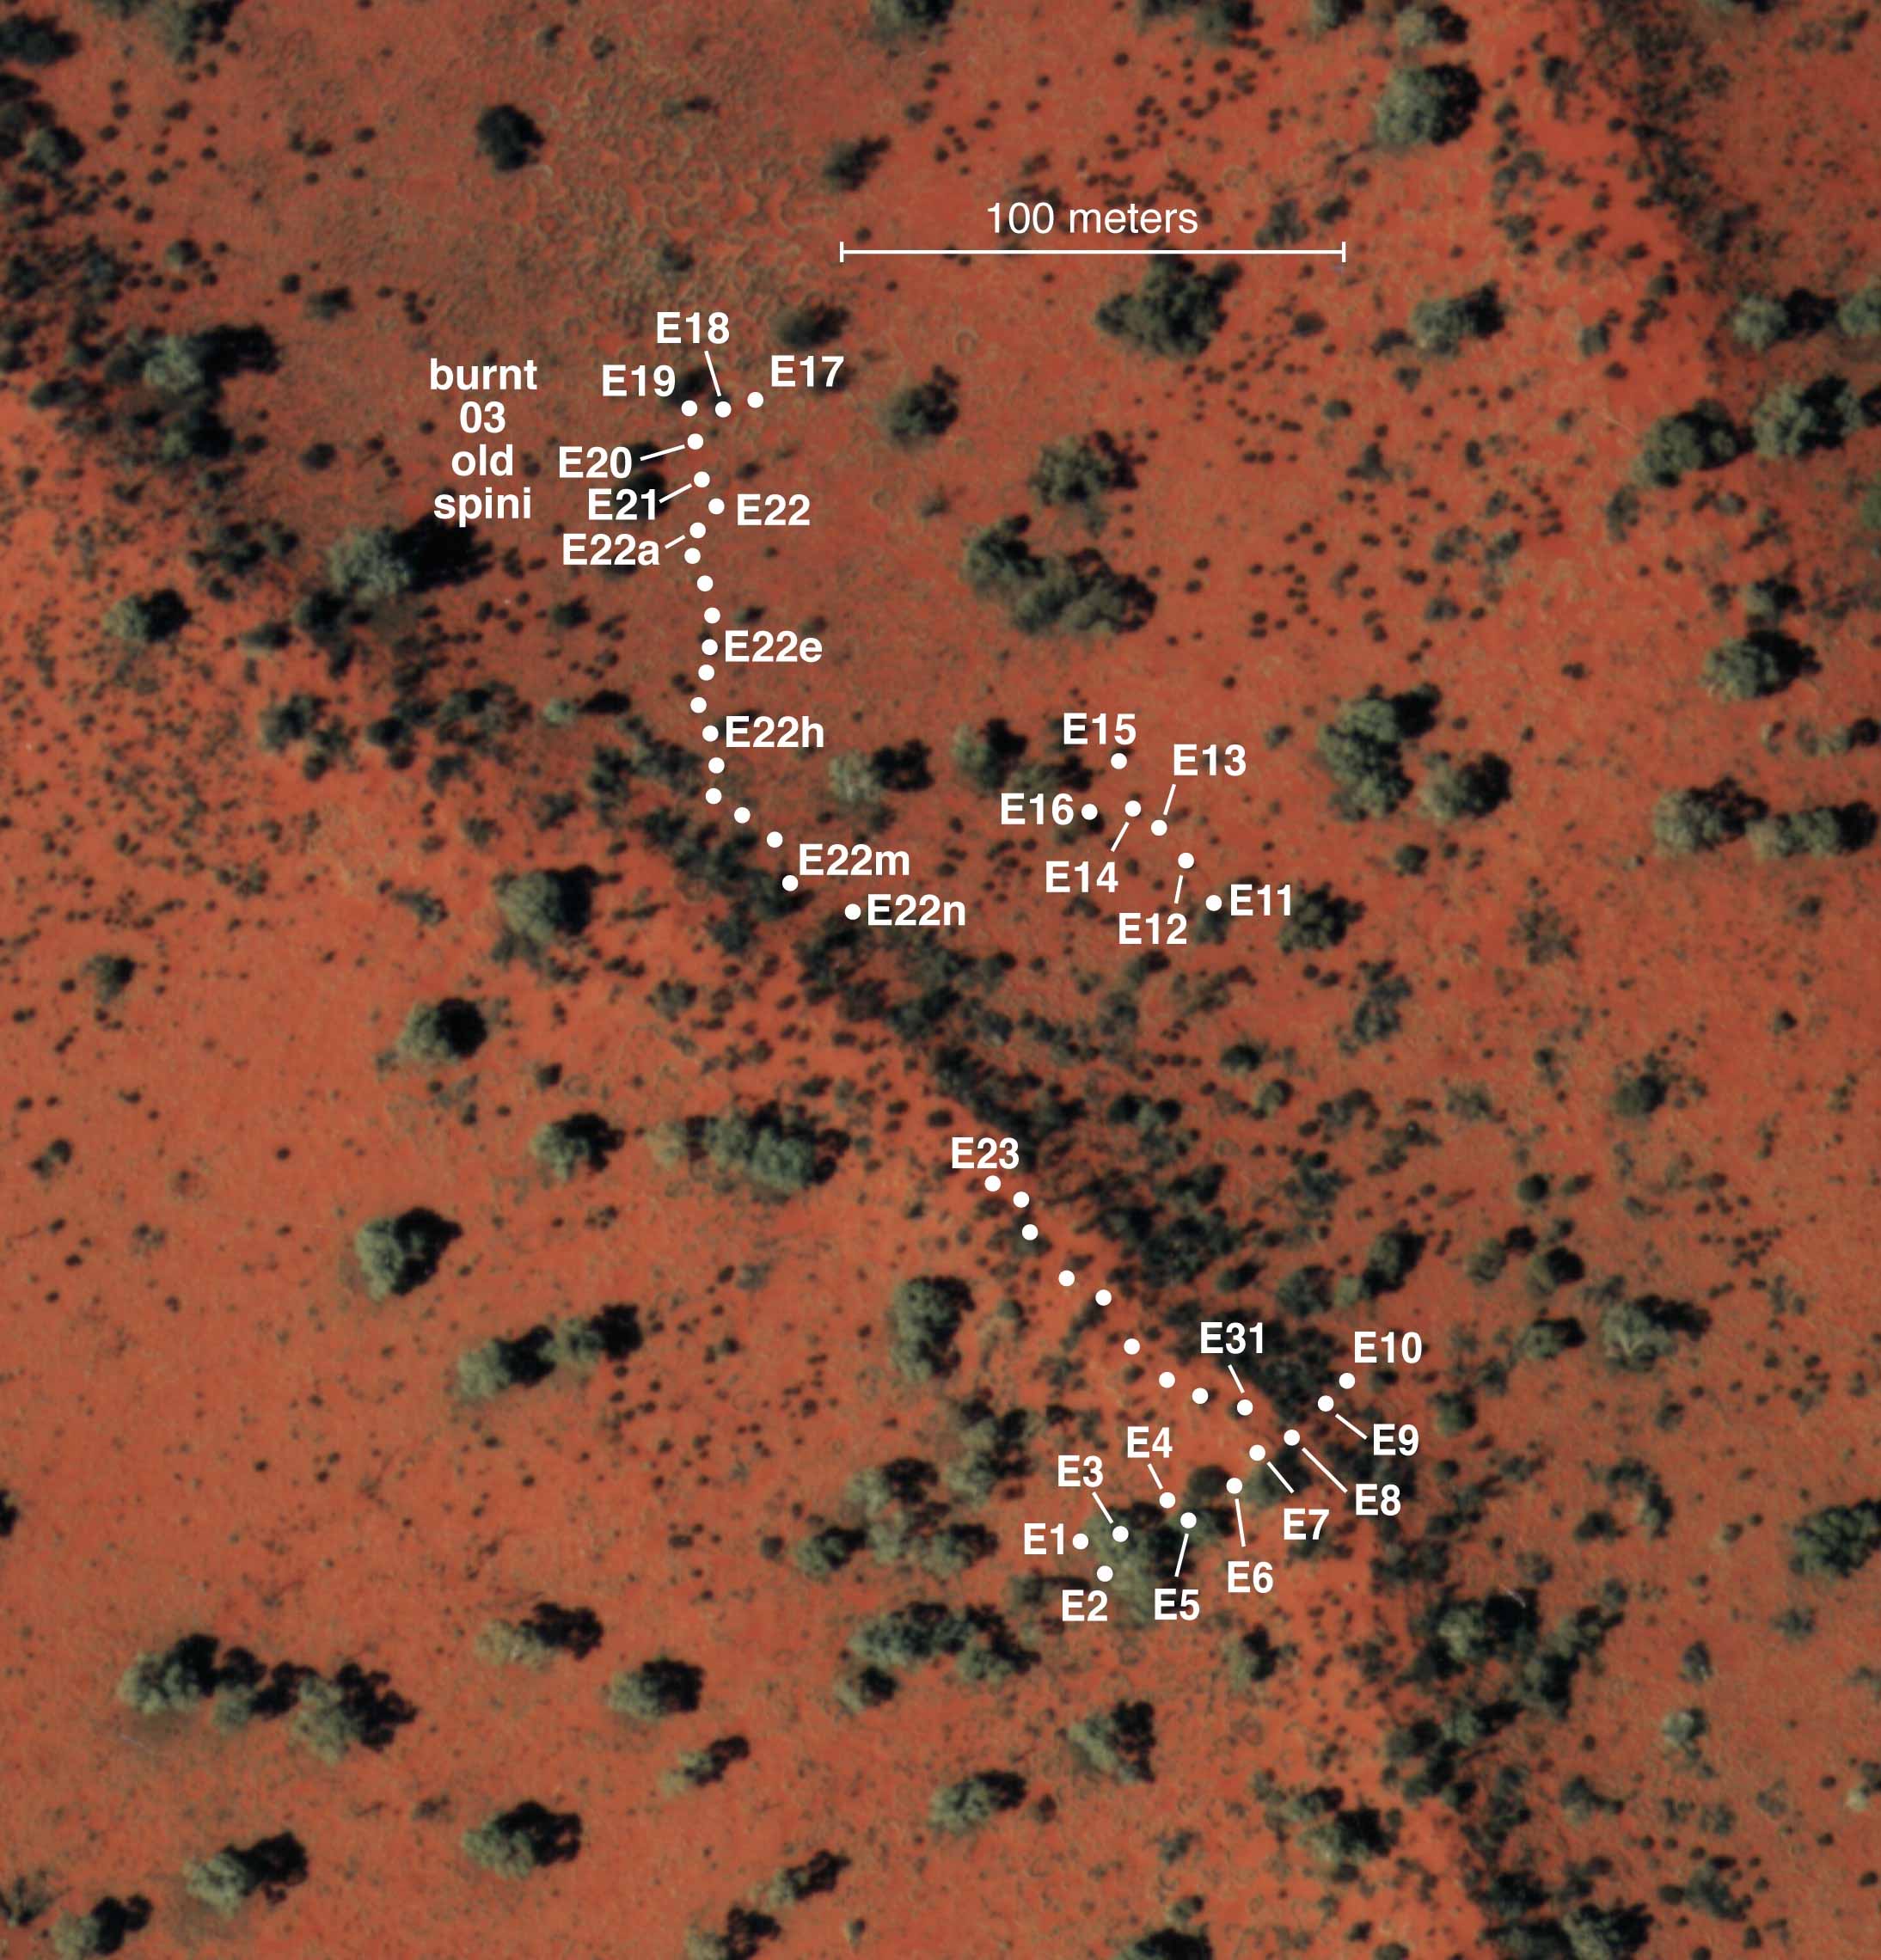
The East pit trap line at Redsands, runs diagonally accross the scene. Large green areas are Marble gum trees. Thousands of lizards and dozens of species have been collected from these pits over the past two decades. I have similar data for 3 other pit trap lines During two decades from 1989 through 2008, I made six trips down under (in 1989-91, 1992, 1995-96, 1998, 2003, and 2008) concentrating my efforts on several Australian study sites and began extensive pit trapping (about 60,000 trap days, and 12,634 specimens) in the Great Victoria Desert. Pit traps were located precisely on high-resolution aerial photos (one shown above) of study areas for a GIS analysis of habitat and microhabitat requirements. A census was taken on a long unburned site to obtain pre-burn data, which was burned in 1995, with subsequent post-burn censuses in 1995, 1998, 2003, and 2008. Pit locations were also plotted on high resolution aerial photos of this site. Data Protocols Stomach contents of these lizards will be exploited to evaluate how arthropod prey resources change during the fire succession cycle. Snakes, birds, and mammals observed on study areas were recorded, and, in some cases, collected. Whenever possible, lizards were collected so that their stomach contents and reproductive condition could be assessed later in my laboratory. Resulting collections of some 3,979 North American specimens, 5,375 Kalahari animals, plus 18,467 Australian ones, representing nearly 100 species in eleven of the 21 extant families of lizards, are lodged in the Los Angeles County Museum of Natural History, the Museum of Vertebrate Zoology of the University of California at Berkeley, and the Western Australian Museum. In all three continental desert-lizard systems, the same 15 basic microhabitats were recognized: subterranean (for unknown, presumably largely historical, reasons, no subterranean lizards exist in North American deserts), open sun, open shade, grass sun, grass shade, bush sun, bush shade, tree sun, tree shade, other sun, other shade, low sun (within 30 cm. above ground), low shade, high sun and high shade (over 30 cm. above ground). For some purposes, finer microhabitat resource states were used. Lizards at an interface between two or more microhabitats were assigned fractional representation in each. Only undisturbed lizards were used in these analyses. Considerable fidelity in microhabitat utilization is evident. Many species separate out using just these 15 very crude microhabitat categories: for example, some species frequent open spaces between plants to the virtual exclusion of other microhabitats, whereas other species stay much closer to cover. In analysis of stomach contents, the same 20 basic prey categories were distinguished on all continents. Prey items were counted and their volumes estimated. As is true of microhabitat utilization, considerable consistency in diet is evident among species. For example, some species eat virtually nothing but termites, whereas others never touch them. Moreover, diets of many species change little in space or time. For some purposes, much finer prey categories could be used. Termites were identified to species and caste for Kalahari lizards. Similarly, I was fortunate to get a competent entomologist to identify prey to the finest possible categories for the 1978-79 Australian data set resulting in 300 prey categories. A major virtue of these data is that identical methods and resource categories were used by the same investigator for each of three continental desert-lizard systems, enabling meaningful intercontinental comparisons. This unique body of data has thus allowed detailed analyses of resource utilization patterns and community structure in these historically independent lizard faunas. Moreover, both dietary and microhabitat niche breadths and overlaps can be estimated as well as species diversities and the spectra of resources actually exploited by entire lizard faunas varying widely in number of species. Another dimension that can often be profitably interpreted is variation in species utilization patterns (niche shifts) between areas. I have done little with ontogenetic changes, variation, or sexual dimorphisms but these data should be examined from those perspectives. In any undertaking of this magnitude, errors inevitably arise. These range from transposed numbers to typographic errors. Quality control is necessary to assure data accuracy. In many instances, only I will be able to correct suspected errors. In some cases, data will have to be discarded when it cannot be verified. Next, I briefly describe various types of data. Fresh snout-vent length (SVL), tail lengths, and weights were measured for all lizards before preservation. Regressions of whole unbroken tail lengths on SVL allowed estimation of tail lengths for lizards with broken or regenerated tails. Nine morphological measurements were made on a subset of preserved specimens of each species: snout-vent length, head length, head width, head depth, jaw length, foreleg length, hindleg length, forefoot length, and hindfoot length. Preserved tail length can be estimated from fresh tail lengths. Some of these morphological measurements have been digitized but these need to be collated with other files to associate sex with anatomy. Many more morphological measurements remain to be digitized and specimens collected since 1995 have not yet been measured. These data will be checked for accuracy by plotting each morphometric against SVL and looking for outliers. My Ph. D. research took place in the early 1960's when data were entered on to mainframe computers using punched 80 column computer cards. I wrote my own programs to analyze these data. Information on each individual lizard was input on two 80 column fields using a continuation card, with study site, a unique specimen ID number, species identity, sex, date, time of collection, length of fat bodies, gonad condition (testis lengths for males, number of eggs and average egg diameter for females), weight, fresh field measured snout-vent length, fresh tail length, tail condition, body temperature, ambient air temperature at chest height, where the lizard was when first sighted, where it ran to, how many times it ran, total number of prey items and total volume of prey in the stomach. Items in stomach contents were scored by number and volume using 20 basic prey categories. These data files for almost 4,000 lizards are in simple text file format and need to be carefully converted into spreadsheet files with a single line of data for each individual lizard. Sex must be added accurately to a separate data set with preserved morphometrics to allow analysis of sexual dimorphisms in diet and microhabitat. I also made up some prey size data files for North American lizards. All snakes were collected and small mammals were trapped (these are deposited in the Burke Memorial Museum at the University of Washington in Seattle). Bird lists were also assembled (Pianka 1967). Data collected for each Kalahari lizard (N = 5375) in the field were as follows: unique ID number, species identity, sex (if possible), ambient air temperature at chest height in ĪC, body temperature in ĪC, time of collection, date, latitude, longitude, where the lizard was when first sighted, and where it ran to, fresh field measured snout-vent length, fresh tail length and condition, and weight in grams. This information has been digitized and converted to excel spreadsheet files. Later, in the lab, lizards were dissected, stomachs were removed and their sex and reproductive state was determined. Protocols of these data sheets, one for five individual lizards, have never been digitized, but were summarized by hand, and need to be entered into electronic format and cross checked. In addition to using the same 20 different prey categories that were used for North American desert lizards, another more detailed Kalahari dietary data set identified termites to species and castes based on 46 prey categories. Snakes were collected and bird lists were assembled (Pianka and Huey 1971). During 1970, we visited the Namib Desert in Namibia and collected several hundred lizard specimens of about a dozen different species. Supporting data were gathered on time of activity, body and air temperature, microhabitat, SVL, tail length, and body weight. These lizards were dissected and sexed and their stomach contents were identified but none of these data were digitized or published. These valuable data will also be included on the DVD. For every lizard collected, the following information was collated in field notebooks: unique ID number, genus, species, sex (if possible), date, time of collection, body temperature in oC, ambient air temperature at chest height in oC, where the lizard was when first sighted, and where it ran to, where the lizard was found on sandridge sites (flat, base, slope, or crest), fresh field measured snout-vent length, fresh tail length and condition, and weight in grams. For many thousands of lizards collected from 1992 through 2008, pit trap numbers were also recorded. Some of this information has been digitized, but several thousand lizards have not yet been entered. As in North America and the Kalahari, Australian lizards were dissected and sex and reproductive condition ascertained. Stomachs were removed and stomach contents identified into the same basic list of 20 different prey categories, most insect orders, only 19 of which occurred in Australia (solpugids are present in North America and the Kalahari, but absent in Australia). All snakes were collected and bird lists were assembled (Pianka and Pianka 1970). In 1978-79, a Guggenheim Fellowship allowed me to focus attention on two study areas: the L-area (N = 1567 lizards) and Redsands (N = 1436 lizards), to better characterize resource utilization by rare species. I hired a competent entomologist Dr. Thomas D. Schultz to go through stomach contents of these lizards identifying prey to the finest resolution possible. Ants and termites were placed into size and/or color categories by family to generate some 97 ant and 58 different termite resource states. A total of 300 different prey categories were recognized, not all of which were present at either site alone. These data have been digitized but need to be linked to another file and cross checked against original data sheets. The Australian Bureau of Meterology reports that long-term average annual precipitation for the Great Victoria Desert is less than 200 mm. Moreover, whereas average annual rainfall over the past decade has fallen in coastal areas, precipitation has increased in the interior. During the past 10 years, rainfall in the GVD has been about 10% above the long-term average. In 2003, I was stunned that I did not recognize my long-term study areas and actually drove right past them because shrubs had increased so greatly in abundance! Spinifex, a vital microhabitat for many lizard species, has diminished with the increased abundance of shrubs. As a result of this increased rainfall, shrub encroachment seems to have changed these ecosystems profoundly. The changing vegetation appears to have affected both avian and lizard populations, and most likely has also impacted arthropod populations upon which birds and lizards depend for food. Old photographs of study sites will be compared with recent ones to document these changes in the vegetation. Changes in the relative abundances of lizard species and in their diets over this decade will constitute further evidence of global climate change. Understanding rarity constitutes a major challenge for ecologists. About one-third of the species studied here are relatively abundant 'core species,' and the other two thirds are uncommon 'occasional species' (Magurran and Henderson 2003), some of which are extremely rare. Over the last 42 years, I have captured migrants of a number of species (Ctenophorus fordi, Ctenophorus scutulatus, Ctenotus leae, Ctenotus leonhardii, Lophognathus longirostris, and Nephrurus vertebralis) dispersing through habitats that they do not normally occupy. I have also witnessed metapopulation-like local extinctions and colonization in a few species. Rarity has proven to be exceedingly difficult to study, but rare species could well be very important to community function (Main 1982, Morton and James 1988; Thompson et al. 2003). So far, inadequate sample sizes have prevented me from doing much with uncommon species, but I have now finally managed to acquire large enough samples to understand the ecologies of most of them. Of the 66 Australian species studied, sample sizes are now less than 10 for only 6 species and samples exceed 30 for 48 species. For each uncommon species, I intend to determine whether rarity is due to mere dispersal into alien habitats or whether it is associated with scarce resources such as limited food or microhabitat availability. These lizard populations can be viewed using a metaphor: their relative abundances are analogous to waves in a hyper-dimension with co-ordinates representing the abundances of various species moving up and down and around in space and time. At any given time, some species are abundant while others may be scarce. One of my goals is to describe this multidimensional spatial-temporal wave-like landscape. 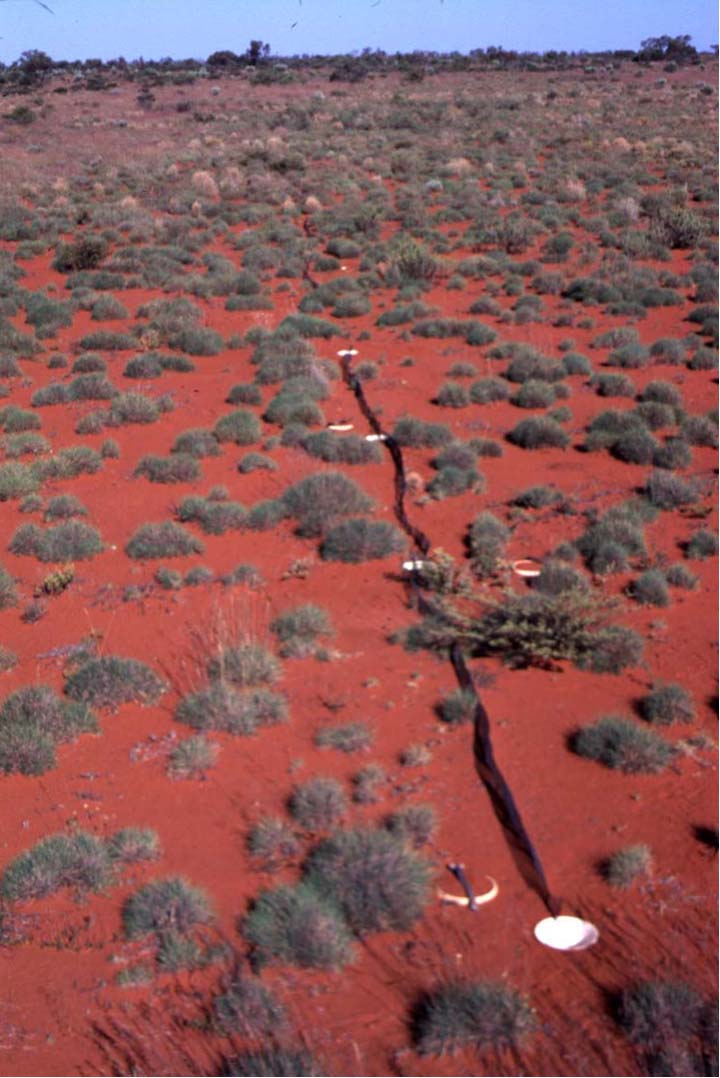
Pit trap line on the B-area. MacArthur (1965) identified several different types of species diversity based on the size of the area sampled. He named two of these within-habitat diversity and between-habitat diversity. In the limit, as space is collapsed down to a single point, he suggested that ōpoint diversityö might be an informative measure as it avoids sampling area. Relatively few efforts have been made to estimate point diversity, but pit traps allow their measurement. Pits were first installed on the L-area and at The R-area in September 1989. Five gallon plastic buckets were buried with their lips flush with the ground surface with drift fences about 20-25 cm high between pits. Individual pits were numbered. Additional pits were added in subsequent years, culminating in a total of 100 pits on the L-area, 100 pits at the R-area, and 75 pits on the B-area. Thousands of lizards have now been pit trapped at these 3 sites in the GVD from hundreds of pits arranged over a spatially heterogeneous landscape. A total of 62,226 pit trap days, most during Austral spring (September-November) from 1989-2008 has yielded 12,634 specimens. Numbers of individuals of each species trapped in each trap have been have tallied up. Some species are associated with sand ridges, others with flat sand plains between sand ridges, and still others with litter under marble gum trees. I have summed up the proportions of each species that were collected on flat sand plains, the base of sand ridges, the slopes of sand ridges, and the crests of sand ridges. Some species are specialized to only one of these habitats, while others have broader habitat niches. Pit trap data provide replicated estimates of point diversity through time. Pit traps vary widely in the numbers of individuals and species captured, as well as their relative abundances. Some pits are ōhotö and catch many more individuals and species than others. For example, some pits captured hundreds of individuals of dozens of species whereas others, in apparently similar habitats nearby, captured only dozens of individuals of just a few species over the same time interval. As explained above, some habitat-specialized species are found only on flat sand plains between ridges, and others occur only on sand ridges. Still other species have more flexible habitat requirements. I will categorize what features of the landscape various lizard species respond to, and then classify pits by what species they catch using multivariate analysis. Sand ridge pits should clump together based on what they captured. Strong positive and negative correlations between pairs of species will be identified (i.e., is species A likely to be captured in the same pits as species B, or are they unlikely to be captured together but found in different pits). Of 26 strong correlations between such pairs of species, only 4 are negative. Understanding exactly why such correlations occur is a prime objective. Low-level, high-resolution aerial photographs were acquired of these three areas. Precise positions of pit traps have been plotted on these aerial photographs. Using a geographical information system (GIS), I will assess habitat requirements of various species, as well as whether species are positively or negatively correlated with each other over space and time. Habitat requirements of Australian desert lizard species will be analyzed using these extensive pit trap records of many thousands of individuals of dozens of species over a 20-year period. I will look for correlations between how far each pit is from various features such as sand ridges, marble gum trees, acacia bushes, termitaria, etc., all of which can be seen on the aerial photographs. I will estimate the appropriate size of the neighborhoods for each lizard species. Some, such as monitor lizards move over great distances, whereas others, especially small species such as litter-specialized skinks, are much more sedentary. I will begin with the most abundant species and work towards less abundant ones, which might not provide much signal and will obviously be harder to understand. This effort will contribute to understanding rarity. When I was invited to write "The structure of lizard communities" for the Annual Review of Ecology and Systematics early in the 1970's, I assembled resource matrices for diets and microhabitats for what I called the "merged decks" which represented all the lizards of each species collected at all study sites within each continental-desert lizard system (Pianka 1973). These were updated and published as appendices in Pianka (1986). Later for my chapter in the MacArthur memorial volume, I performed a comparable site-by-site analysis, assembling resource matrices for diets and microhabitats for all the lizards from each study site. These have not yet been published. A computer program read these as input files and generated overlap matrices as output. These files are useful because they provide concise summaries of utilization of prey and microhabitats by various species. Resource matrices allow quantification of niche breadth and overlap. I collected heart and liver tissue samples for all Australian species and froze them in liquid nitrogen during 1989-90. These samples were deposited in the Evolutionary Biology Unit at the South Australian Museum under the curatorship of Dr. Stephen Donnellan. With funding from the National Geographic Society in 1996, I traveled to eastern and northern tropical Australia and collected voucher specimens and tissues for many species of Ctenotus skinks in Queensland, the Northern Territory, and the Kimberley of Western Australia. I now have DNA from almost all described species of Ctenotus -- these are being used to reconstruct the phylogeny, which will then be exploited to understand the probable course of evolution within this large clade (about 100 species). In addition, I took minced liver tissues from various other Australian lizards and stored them either in DMSO-NaCl buffer or in 95% ethanol (these are stored in an ultra-cold freezer at UT Austin). DNA sequences of some of these lizards will be included on the DVD and will be used to reconstruct phylogenies for explicit phylogenetic studies using modern comparative methods (see below). Lizards have proven to be ideal subjects for ecological studies: work on them has revealed many basic ecological principles (Milstead 1966; Huey et al. 1983; Vitt and Pianka 1994). These model organisms are abundant, easily observed and captured, low in mobility, extremely hardy in captivity, and can be marked and monitored for many years. Moreover, they eat their prey whole allowing stomach content analyses and quantification of diets. Because lizards are ectotherms, they respond rapidly to climatic change and can be used to monitor global weather change. Phylogenies have now been constructed for many lizard clades, allowing application of modern comparative methodology to elucidate the probable actual course of evolution of many traits. Lizards have evolved in response to desert conditions independently within each of these 3 continental desert systems. Intercontinental comparisons reflect the extent to which interactions between the lizard body plan and desert environments are determinate and predictable. Convergences observed between such independently evolved ecological systems provide important insights into the operation of natural selection and underscore general principles of community organization. If this project is funded, I will be able to make major advances in understanding the ecology and diversity of Australian desert lizards. I will be able to undertake a series of important phylogenetic analyses elucidating probable evolutionary pathways for a wide variety of important traits including functional anatomy, activity times and temperatures, foraging tactics and diets, reproductive tactics, habitat and microhabitat utilization, and relative abundances. I will make progress towards understanding the ecology of rare and uncommon species as well as why they are uncommon. I will be able to document long-term ecosystem changes due to global climate change as well as those occurring during the fire succession cycle. Also, I will undertake pioneering studies on point diversity and habitat requirements, and map the ever-changing multidimensional spatial-temporal waves of relative abundances. Finally, funding this proposal will help in organizing invaluable old ōfossilö data as well as a large amount of new data so that they can be safely preserved for future generations. 1. Lizard faunas and foods eaten on the B-area will be examined at five different time intervals in the fire succession cycle from original long unburned to 13 years post-burn to better understand the dynamics of this ecosystem. These long-term census data will provide insights in to how individual species respond to fires (species composition, relative abundance, dietary flexibility, and reproductive tactics). 2. Habitat requirements of Australian species will be analyzed using extensive pit trap records of many thousands of individuals of dozens of species over two decades. Precise positions of pit traps plotted on low-level, high-resolution aerial photographs will be analyzed using a geographical information system (GIS) to assess habitat requirements of various species, as well as whether species are positively or negatively correlated with each other over space and time. 3. About two thirds of the species are uncommon -- these can now be better characterized and I will finally be able to begin to attempt to understand rarity (a major challenge facing ecologists). 4. Changes in relative abundances of species from site to site and through time at two long-term study sites will be compared and related to fires, climate change, and shrub encroachment. 5. Ecological and anatomical changes during ontogeny and sexual dimorphisms between males and females will be examined. 6. In collaboration with my former graduate student Dr. W. Bryan Jennings (Humboldt State University), we plan to analyze the evolution of body and head size and shape, as well as head and tail proportions among pygopodid lizards. Some species are terrestrial, others fossorial, and still others are arboreal. We will use the phylogeny reconstructed by Jennings et al. (2003) but will include new sequences from additional slowly evolving nuclear genes (such as Rag-1) to clarify deep phylogenetic relationships. Heads are being scanned in Dr. Timothy Rowe's Digimorph laboratory using 3-dimensional high-resolution digital catscans. Haydon, D. T., J. K. Friar, and E. R. Pianka. 2000a. Fire Driven Dynamic Mosaics in the Great Victoria Desert I: Fire Geometry. Landscape Ecology 15: 373-381. Haydon, D. T., J. K. Friar, and E. R. Pianka. 2000b. Fire Driven Dynamic Mosaics in the Great Victoria Desert II: A spatial and temporal landscape model. Landscape Ecology 15: 407-423. Huey, R. B., E. R. Pianka, and T. W. Schoener (eds.) 1983. Lizard Ecology: Studies of a Model Organism. Harvard University Press. 501 pp. Huey, R. B., E. R. Pianka, and L. J. Vitt. 2001. How often do lizards ōrun on empty?ö Ecology 82: 1-7. Jennings, W. B., E. R. Pianka, and S. Donnellan. 2003. Systematics of the lizard family Pygopodidae with implications for the diversification of Australian temperate biotas. Systematic Biology 52: 757-780. Leistner, O. A. 1967. The plant ecology of the southern Kalahari. Botanical Survey of South Africa, Memoirs 38: 1-172. Main, A. R. 1982. Rare species: precious or dross? Graves, R. H. and W. D. L. Ride (eds): Species at risk: Research in Australia, pp. 163-174. Australian Academy of Science, Canberra. Milstead, W. W. (ed.). 1966. Lizard Ecology: A Symposium. University of Missouri Press, Columbia. 300 pp. Pianka, E. R. 1966. Convexity, desert lizards, and spatial heterogeneity. Ecology 47: 1055-1059. Pianka, E.R. 1967. On lizard species diversity: North American flatland deserts. Ecology 48: 333-351. Pianka, E.R. 1969. Habitat specificity, speciation, and species density in Australian desert lizards. Ecology 50: 498-502. Pianka, E.R. 1971. Lizard species density in the Kalahari desert. Ecology 52: 1024-1029. Pianka, E. R. 1973. The structure of lizard communities. Annual Review of Ecology and Systematics 4: 53-74. Selected as "This Week's Citation Classic" in Current Contents (Agriculture, Biology & Environmental Sciences) (1988), volume 19 (number 35): page 18.) Pianka, E. R. 1975. Niche relations of desert lizards. Chapter 12 (pp. 292-314) in M. Cody and J. Diamond (eds.) Ecology and Evolution of Communities. Harvard University Press. Pianka, E. R. 1986. Ecology and Natural History of Desert Lizards. Analyses of the Ecological Niche and Community Structure. Princeton University Press, Princeton, New Jersey. Pianka, E. R. 1996. Long-term changes in Lizard Assemblages in the Great Victoria Desert: Dynamic Habitat Mosaics in Response to Wildfires. Chapter 8 (pp. 191-215) in M. L. Cody and J. A. Smallwood (eds.) Long-term studies of vertebrate communities. Academic Press. Pianka, E. R. and R. B. Huey. 1971. Bird species density in the Kalahari and the Australian deserts. Koedoe 14: 123-130. Pianka, H. D. and E. R. Pianka. 1970. Bird censuses from desert localities in Western Australia. Emu 70: 17-22. Thompson, G. G., S. A. Thompson, P. C. Withers and E. R. Pianka. 2003. Diversity and abundance of pit-trapped reptiles of arid and mesic habitats in Australia: Biodiversity for Environmental Impact Assessments. Pacific Conservation Biology 9: 120-135. Vitt, L. J. and E. R. Pianka (eds.) 1994. Lizard Ecology: Historical and Experimental Perspectives. Princeton University Press. 403 pp. Vitt, L. J. and E. R. Pianka. 2005. Deep history impacts present day ecology and biodiversity. Proc. Nat. Acad. Sci. 102: 7877-7881. Winemiller, K. O., E. R. Pianka, L. J. Vitt, and A Joern. 2001. Food web laws or niche theory? six independent empirical tests. American Naturalist 158: 193-199. Return to Pianka lab page |