3|Meteorology
Earth's Physical Environment
Earth supports an enormous variety of organisms. Plants range from microscopic short-lived aquatic phytoplankton to small annual flowering plants to larger perennials to gigantic ancient sequoia trees. Animals, although they never attain quite the massive size of a redwood tree, include forms as diverse as marine zooplankton, jellyfish, sea stars, barnacles, clams, snails, beetles, butterflies, worms, frogs, fish, lizards, sparrows, hawks, bats, elephants, whales, and lions. Different species have evolved and live under different environmental conditions. Some organisms are relatively specialized either in the variety of foods they eat or in the microhabitats they exploit, whereas others are more generalized; some are widespread, occurring in many different habitats, whereas still others have more restricted habitat requirements and geographic ranges. Temporal and spatial variation in the physical conditions for life often make possible or even actually necessitate variety among organisms, both directly and indirectly. Of course, interactions among organisms also contribute substantially to the maintenance of this great diversity of life.
Before considering such biological interactions, we first examine briefly the nonliving world, which sets the background for all life and often strongly influences the ecology of any particular organismic unit. A major factor in the physical environment is climate, which in turn is the ultimate determinant of water availability and the thermal environment; moreover, the latter two interact to determine the actual amount of solar energy that can be captured by plants (primary productivity) at any given time and place. Finally, because climate is a major determinant of both soils and vegetation, there is a close correspondence between particular climates and the types of natural biological communities that exist under those climatic conditions. Populations of many species are directly affected by climate. The interface between climate and vegetation is considered in Chapter 4.
Major global and local patterns of climate are described briefly in this chapter. Entire books have been devoted to some of these subjects, and the reader interested in greater detail is referred to the references at the end of the chapter.
Major Determinants of Climate
The elements of climate (sun, wind, and water) are complexly interrelated. Incident solar energy produces thermal patterns that, coupled with the earth's rotation and movements around its sun, generate the prevailing winds and ocean currents. These currents of air and water in turn strongly influence the distribution of precipitation, both in time and space.
The amount of solar energy intercepting a unit area of the earth's surface varies markedly with latitude for two reasons. First, at high latitudes, a beam of light hits the surface at an angle, and its energy is spread out over a large surface area. Second, a beam that intercepts the atmosphere at an angle must penetrate a deeper blanket of air, and hence more solar energy is reflected by particles in the atmosphere and radiated back into space. (Local cloud cover also limits the amount of the sun's energy that reaches the ground.) A familiar result of both these effects is that average annual temperatures tend to decrease with increasing latitude (Table 3.1). The poles are cold and the tropics are generally warm (seasons are discussed later).
Table 3.1 Average Annual Temperature (° C) at Different Latitudes
__________________________________________________________________
Latitude![]() Year Year![]() January January![]() July July![]() Range Range
__________________________________________________________________
90°N![]() -22.7 -22.7![]() -41.1 -41.1![]() -1.1 -1.1![]() 40.0 40.0
80°N![]() -18.3 -18.3![]() -32.2 -32.2![]() 2.0 2.0![]() 34.2 34.2
70°N![]() -10.7 -10.7![]() -26.3 -26.3![]() 7.3 7.3![]() 33.6 33.6
60°N![]() -1.1 -1.1![]() -16.1 -16.1![]() 14.1 14.1![]() 30.2 30.2
50°N![]() 5.8 5.8![]() -7.1 -7.1![]() 18.1 18.1![]() 25.2 25.2
40°N![]() 14.1 14.1![]() 5.0 5.0![]() 24.0 24.0![]() 19.0 19.0
30°N![]() 20.4 20.4![]() 14.5 14.5![]() 27.3 27.3![]() 12.8 12.8
20°N![]() 25.3 25.3![]() 21.8 21.8![]() 28.0 28.0![]() 6.2 6.2
10°N![]() 26.7 26.7![]() 25.8 25.8![]() 27.2 27.2![]() 1.4 1.4
Equator![]() 26.2 26.2![]() 26.4 26.4![]() 25.6 25.6![]() 0.8 0.8
10°S![]() 25.3 25.3![]() 26.3 26.3![]() 23.9 23.9![]() 2.4 2.4
20°S![]() 22.9 22.9![]() 25.4 25.4![]() 20.0 20.0![]() 5.4 5.4
30°S![]() 16.6 16.6![]() 21.9 21.9![]() 14.7 14.7![]() 7.2 7.2
40°S![]() 11.9 11.9![]() 15.6 15.6![]() 9.0 9.0![]() 6.6 6.6
50°S![]() 5.8 5.8![]() 8.1 8.1![]() 3.4 3.4![]() 4.7 4.7
60°S![]() -3.4 -3.4![]() 2.1 2.1![]() -9.1 -9.1![]() 11.2 11.2
70°S![]() -13.6 -13.6![]() -3.5 -3.5![]() -23.0 -23.0![]() 19.5 19.5
80°S![]() -27.0 -27.0![]() -10.8 -10.8![]() -39.5 -39.5![]() 28.7 28.7
90°S![]() -33.1 -33.1![]() -13.5 -13.5![]() -47.8 -47.8![]() 34.3 34.3
__________________________________________________________________
Water in the atmosphere is warmed by heat radiating from the earth's surface, and much of this heat is radiated back to the earth again. The result is the so-called greenhouse effect, which leads to the retention of heat, keeping the earth relatively warm even at night when there is temporarily no influx of solar energy. Without this effect, the earth's surface would cool to many degrees below zero -- like the dark side of the moon's surface. Thus, the atmosphere buffers day-night thermal change.
-
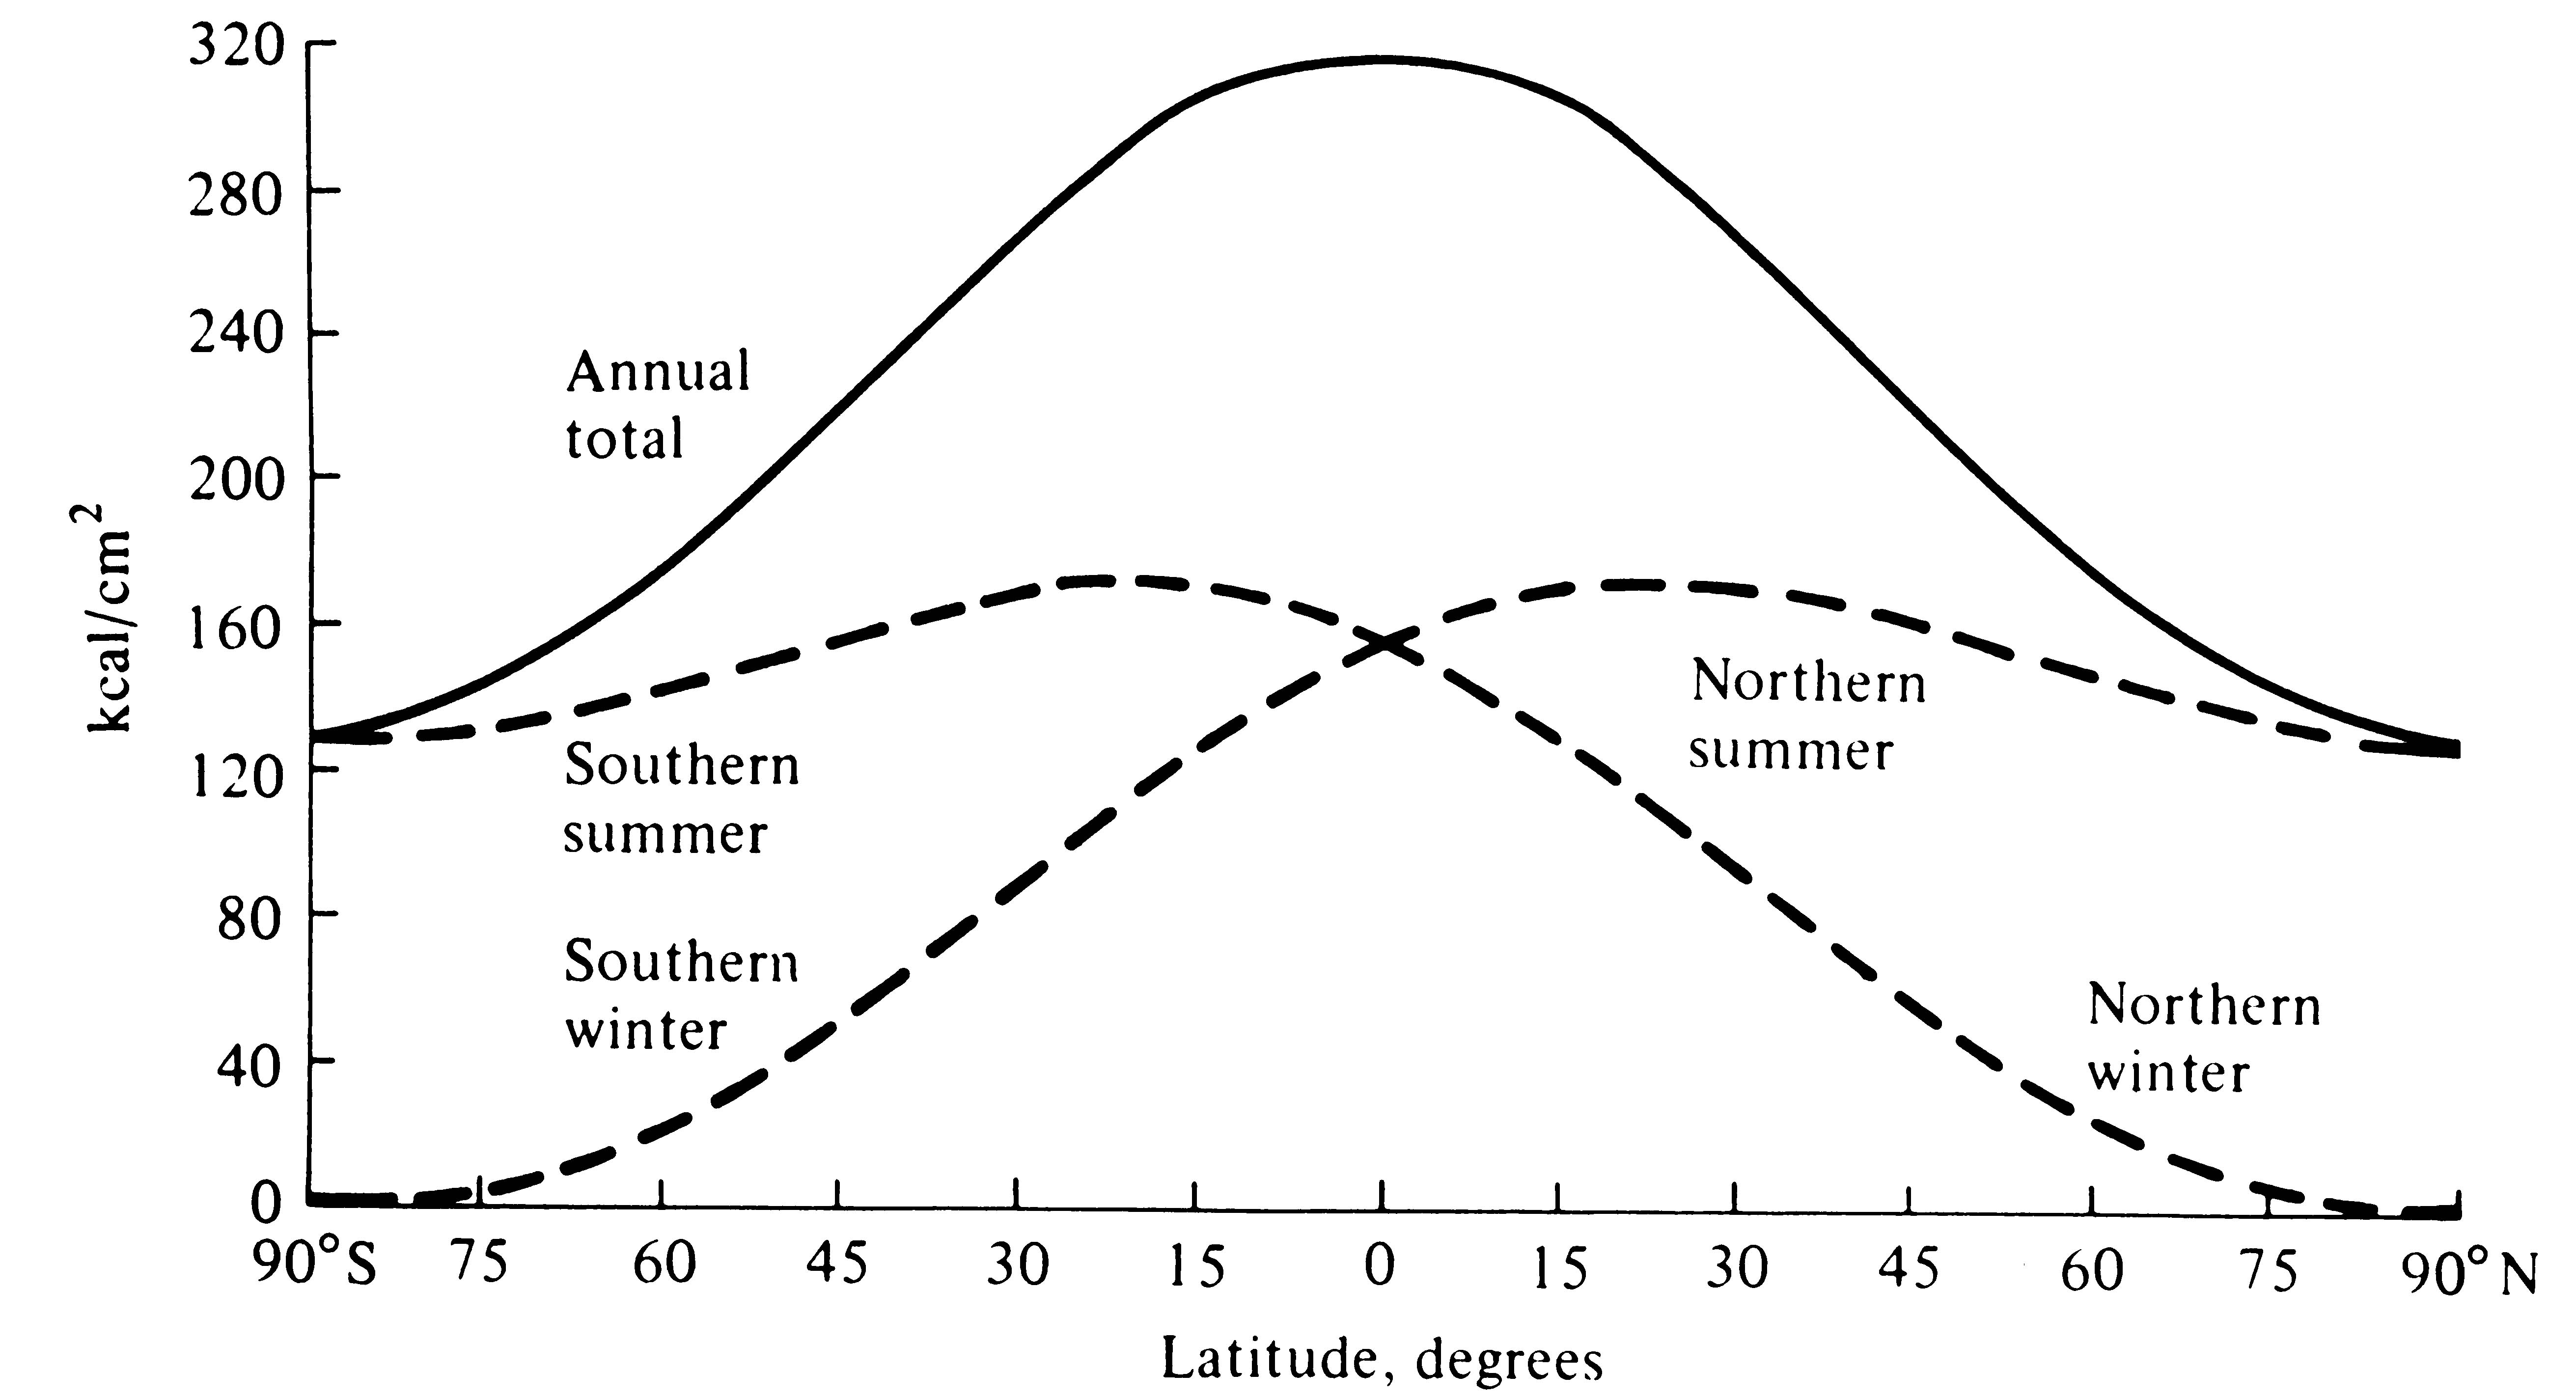
Figure 3.1. Estimated amount of incoming solar radiation that would intercept the earth's surface in the absence of an atmosphere as a function of latitude. The six-month period from the spring equinox to the fall equinox (see Figure 3.7) is labeled "northern summer" and "southern winter," whereas the six months from the fall equinox to the spring equinox represent the "northern winter" and the "southern summer." [After Haurwitz and Austin (1944).]
Hot air rises. The ground and air masses above it receive more solar energy at low latitudes than at higher ones (Figure 3.1). Thus, tropical air masses, especially those near the equator, are warmed relatively more than temperate air masses, and an equatorial zone of rising air is created. These equatorial air masses cool as they rise and eventually move northward and southward high in the atmosphere above the earth's surface (Figure 3.2a). As this cold air moves toward higher latitudes, it sinks slowly at first and then descends rapidly to the surface at the so-called horse latitudes of about 30°N and 30°S. At ground level at these latitudes, some air moves toward the equator again and some of it moves toward the poles. (The amount of air in the atmosphere is finite, so air masses leaving one place must always be replaced by air coming from somewhere else; thus, a closed system of circulating air masses is set up.) An idealized diagram of the typical vertical and horizontal movements of atmospheric currents is shown in Figure 3.2.
At the surface, the equator is a zone of convergence of air masses, whereas they are diverging at the horse latitudes. Between latitudes 0° and 30°, surface air usually moves toward the equator; between latitudes 30° and 60°, it generally moves away
from the equator. As air masses move along the surface, they are slowly warmed and eventually rise again.
(a)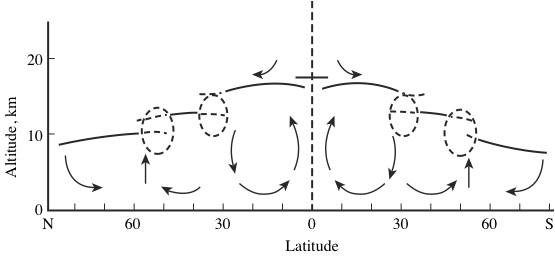
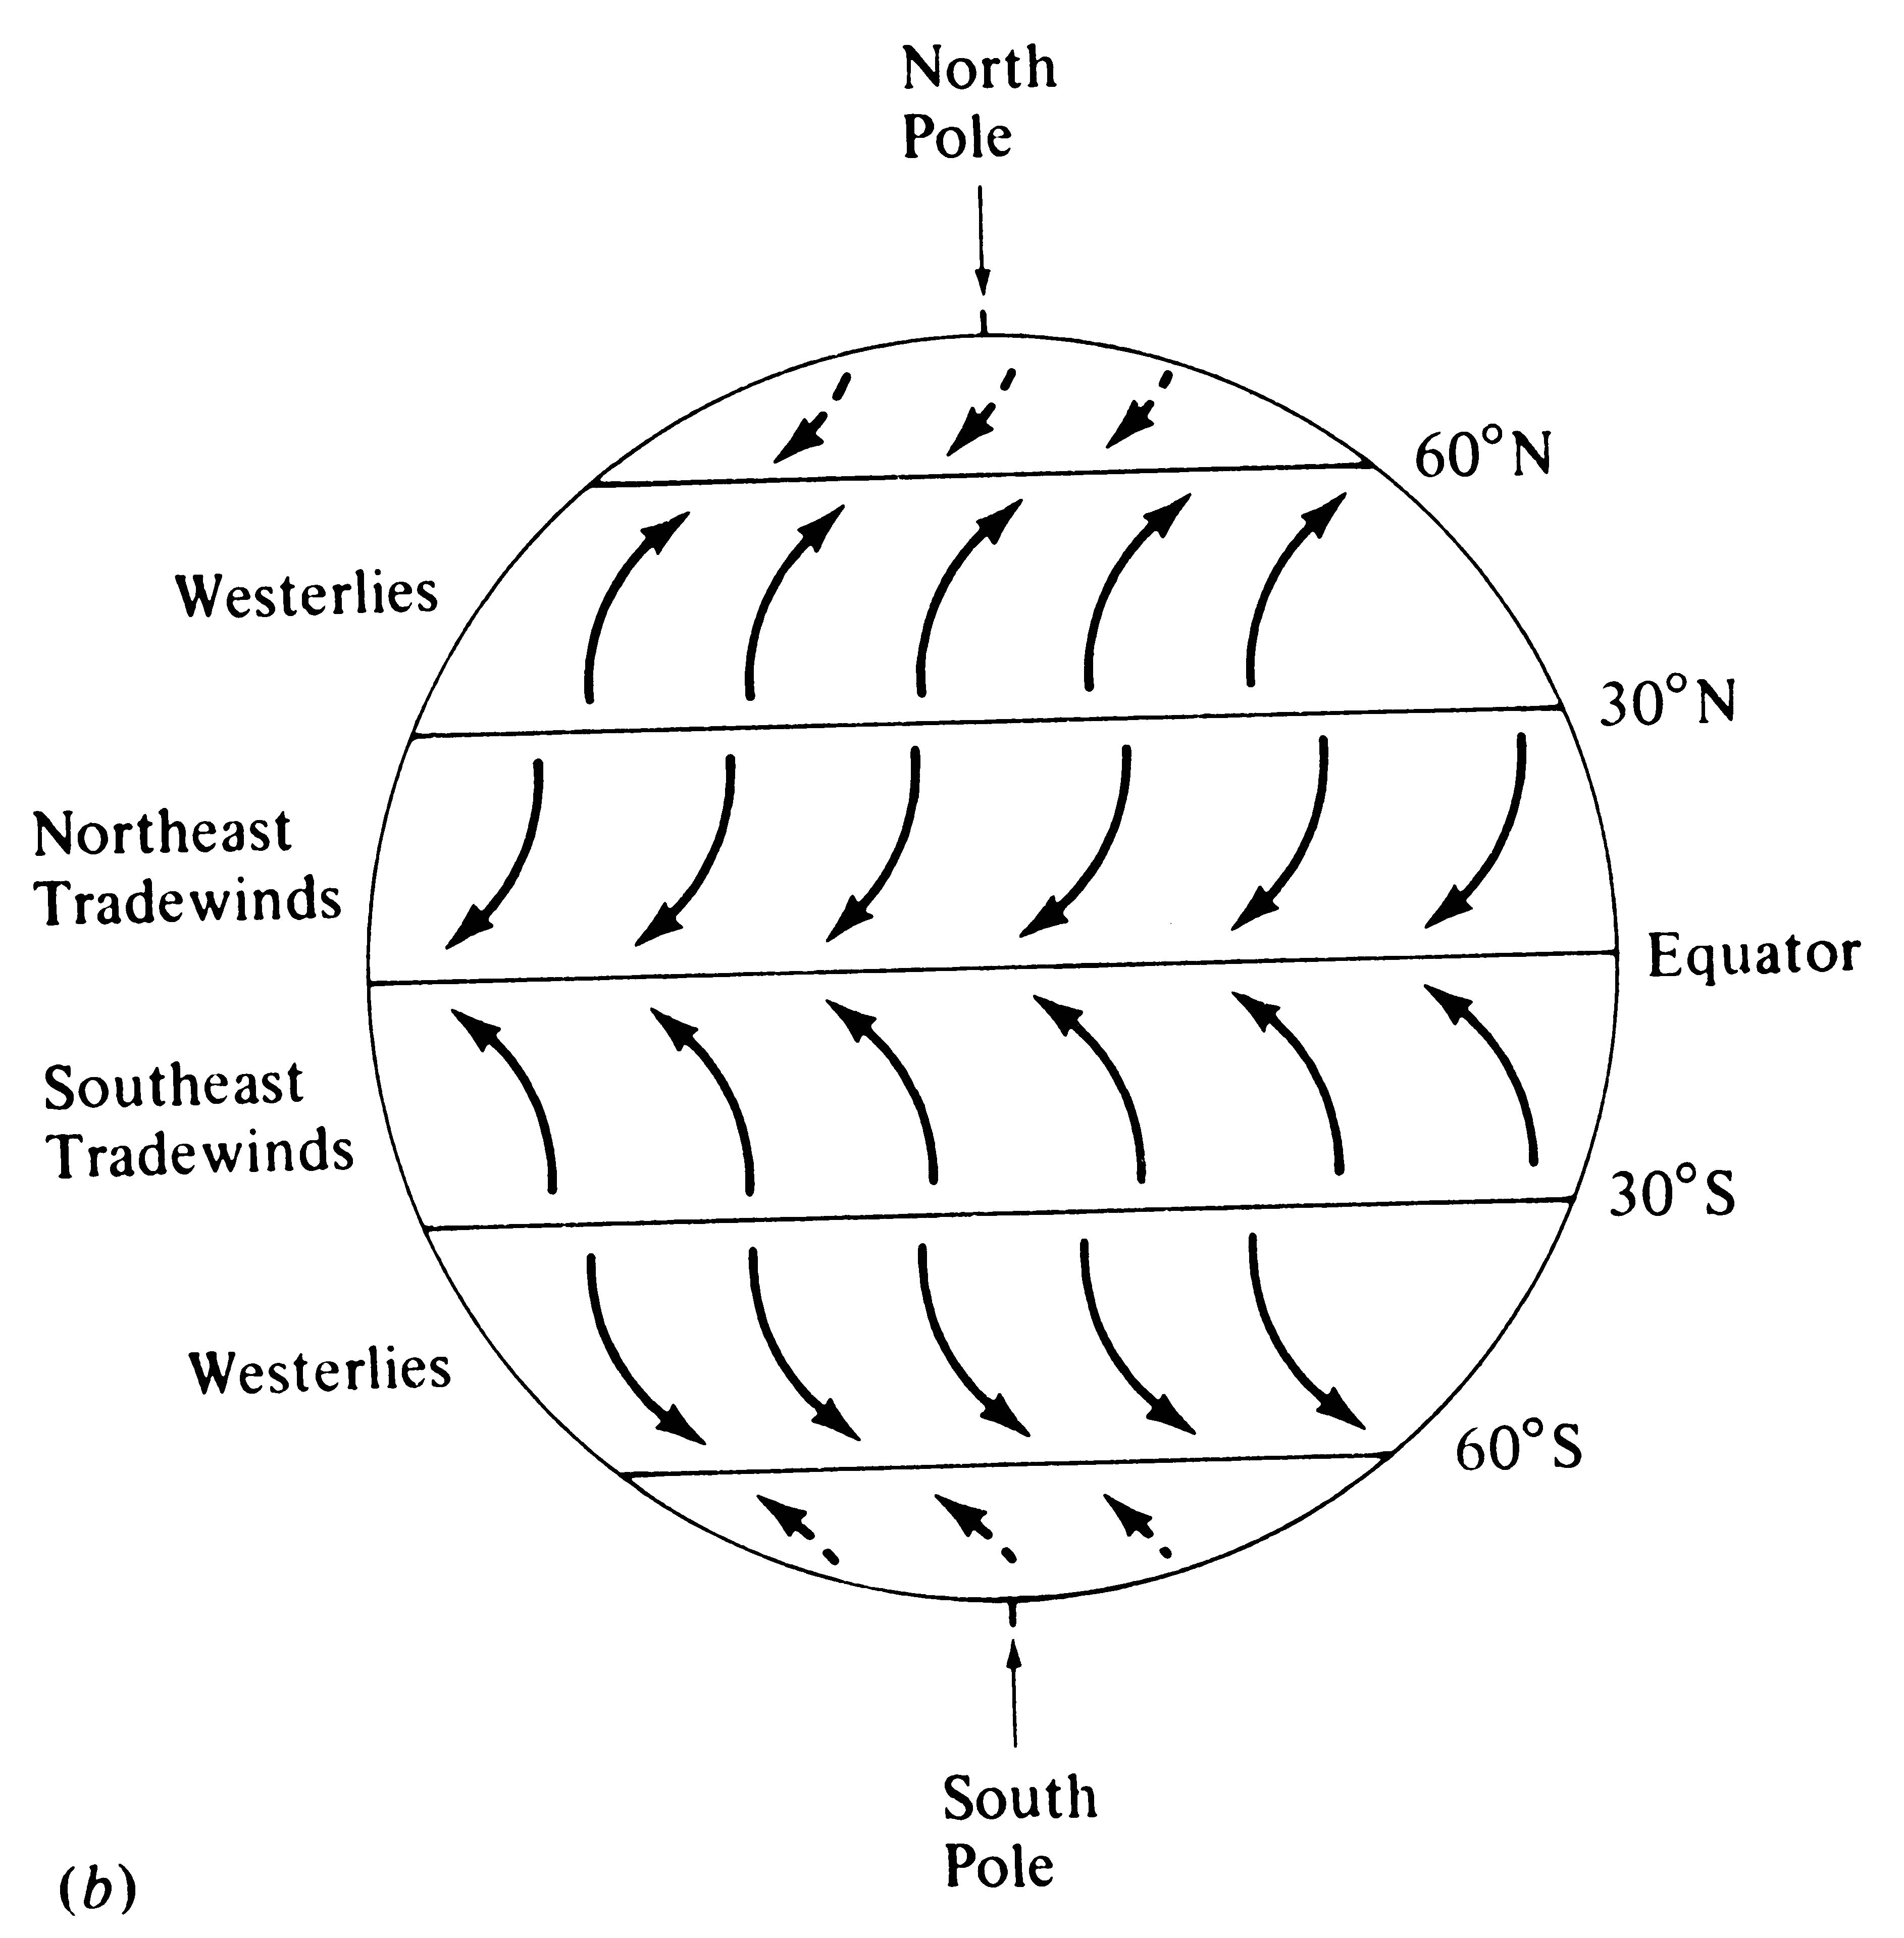 Figure 3.2. Idealized atmospheric circulation patterns. (a) Vertical profile against latitude. (b) Prevailing wind currents on the earth's surface. Dashed ellipses represent positions of jet streams. Belts of moving air move north and south with the seasons. [After MacArthur (1972).]

Movements of air masses are not strictly north-south as suggested by Figure 3.2a; instead, they acquire an east-west component due to the rotation of the earth about its axis (Figure 3.2b). The earth rotates from west to east. A person standing on either pole would rotate slowly around and do a full "about face" each 12 hours. (Near the North Pole the ground moves counterclockwise under one's feet, whereas near the South Pole it moves clockwise; other related important differences between the hemispheres are considered in the following paragraphs.) However, someone located near the equator travels much farther during a 24-hour period; indeed, such a person would traverse a distance equal to the earth's circumference, or about 40,000 km, during each rotation of the globe. Hence, the velocity of a body near the equator is approximately 1600 kilometers/hour (relative to the earth's axis), whereas a body at either pole is, relatively speaking, at a standstill.
Previous considerations, plus the physical law of conservation of momentum, dictate that objects moving north in the Northern Hemisphere must speed up, relative to the earth's surface, and thus veer toward the right. Similarly, objects moving south in the Northern Hemisphere slow down relative to the earth's surface, which means that they also veer to the right. In contrast, moving objects in the Southern Hemisphere always veer to the left; northward-moving objects slow down and southward-moving ones speed up. These forces, known collectively as the Coriolis force, act on north-south wind and water currents to give them an east-west component. The Coriolis force is maximal at the poles, where a slight latitudinal displacement is accompanied by a large change in velocity, and minimal at the equator, where a slight latitudinal change has little effect upon the velocity of an object.
Equator-bound surface air between latitudes 0° and 30° slows relative to the surface and veers toward the west in both hemispheres, producing winds from the east ("easterlies"); these constitute the familiar trade winds, known as the northeast trades between 0° and 30°N and the southeast trades between 0° and 30°S. Between latitudes 30° and 60°, surface air moving toward the poles speeds up (again, relative to the earth's surface) and veers toward the east, producing the familiar prevailing "westerly" winds at these latitudes in both hemispheres (Figure 3.2b).
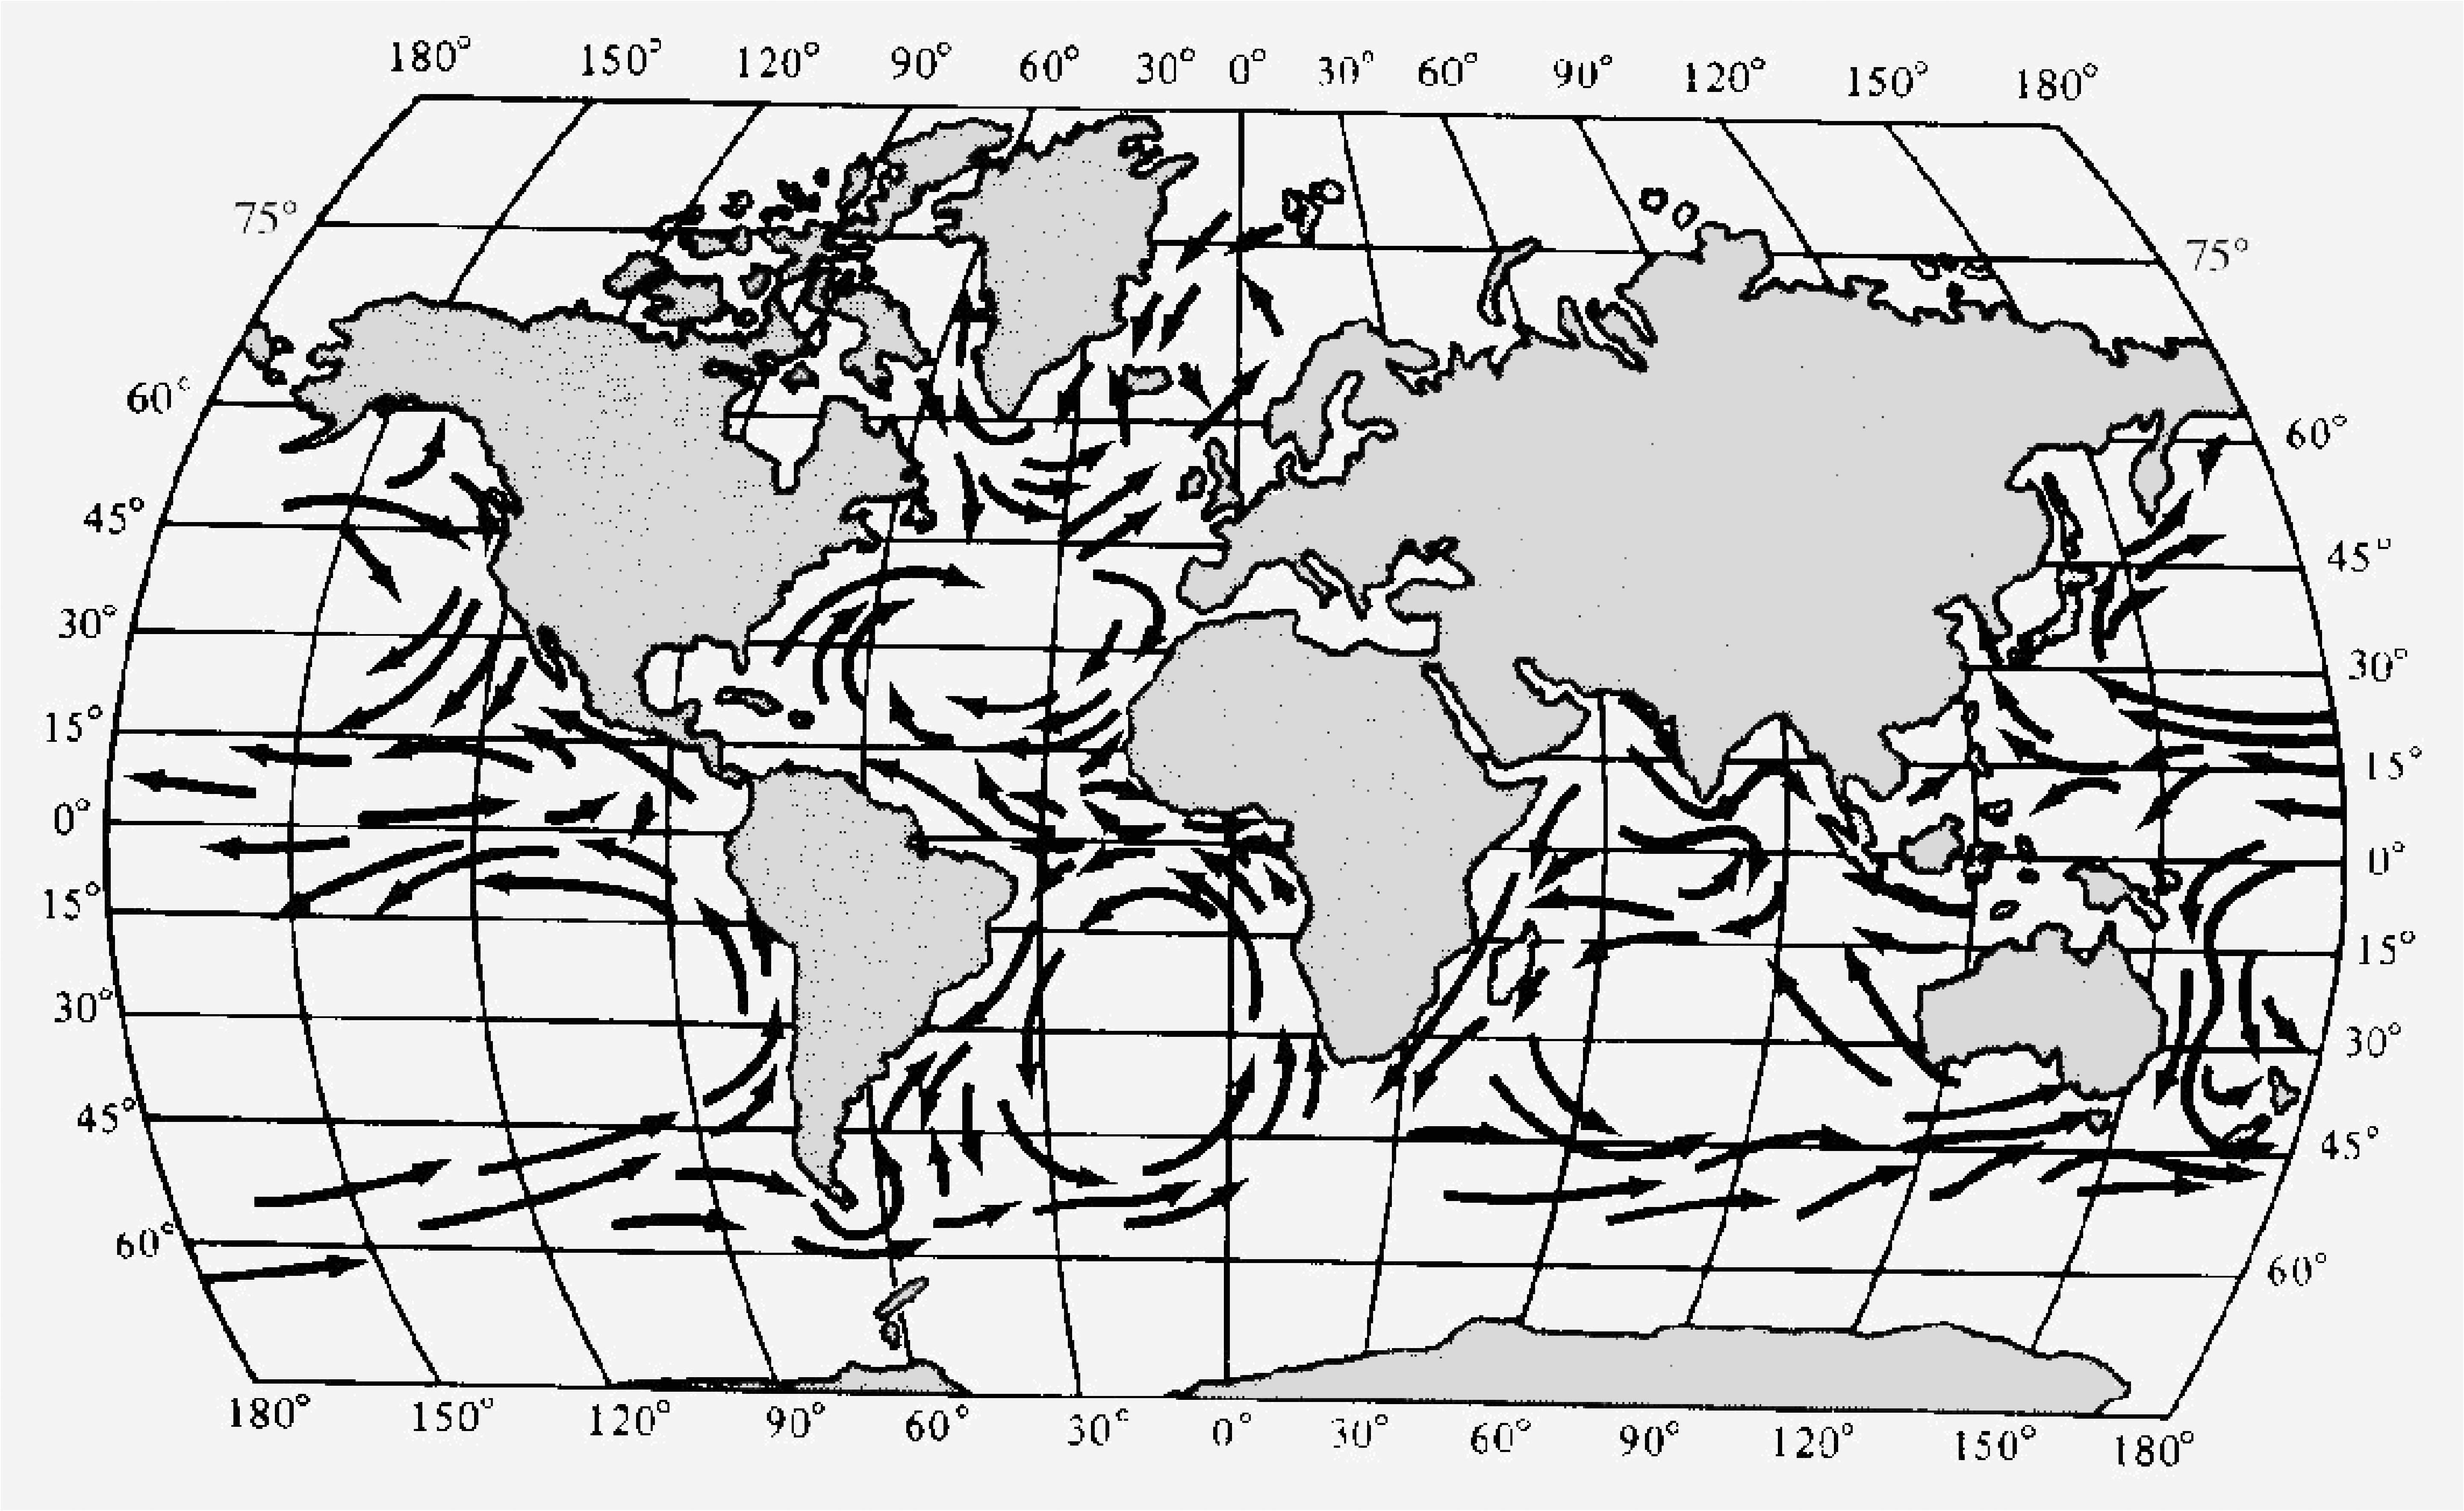
These wind patterns, coupled with the action of the Coriolis force on water masses moving north to south, drive the world's ocean currents; in the Northern Hemisphere, ocean waters rotate generally clockwise, whereas they rotate counterclockwise in the Southern Hemisphere (Figure 3.3).
-
![]() Figure 3.3. Major surface currents of the world's oceans. Figure 3.3. Major surface currents of the world's oceans.
During their movement westward along the equator, oceanic waters are warmed by solar irradiation. (These waters also "pile up" on the western sides of the oceanic basins; in Central America, the sea level of the Atlantic is about a meter higher than that of the Pacific.) As this warm equatorial water approaches the eastern side of landmasses, it is diverted northward and/or southward to higher latitudes, carrying equatorial heat toward the poles along the eastern coasts of continents. Cold polar waters flow toward the equator on west coasts (this is the main reason the Pacific Ocean off southern California is cold but at the same latitude the Atlantic Ocean off Georgia is quite warm).
Heat is molecular movement. Compressing a volume of air results in more collisions between molecules and increased molecular movement; hence, compression causes an air mass to heat up. Exactly analogous considerations apply in the
reverse case. Allowing compressed air to expand decreases the number of molecular collisions and the air mass cools off. As warm air rises, atmospheric pressure decreases, and the air expands and is cooled "adiabatically," or without change in total heat content. Some of the air's own heat is used in its expansion. As descending cold air is compressed, it is adiabatically warmed in a similar manner.
-
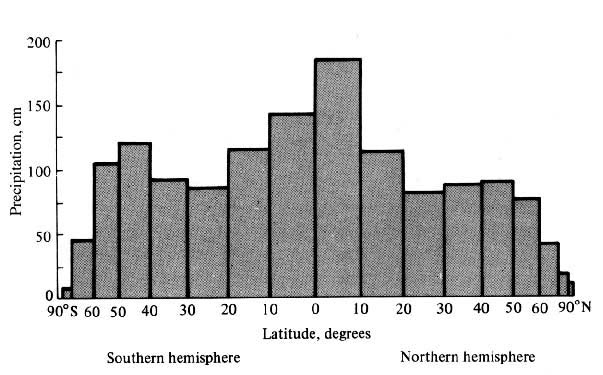
Figure 3.4. Histogram of average annual precipitation versus latitudinal zones. Note the effect of the earth's major deserts in the horse latitudes. [From Haurwitz and Austin (1944).]
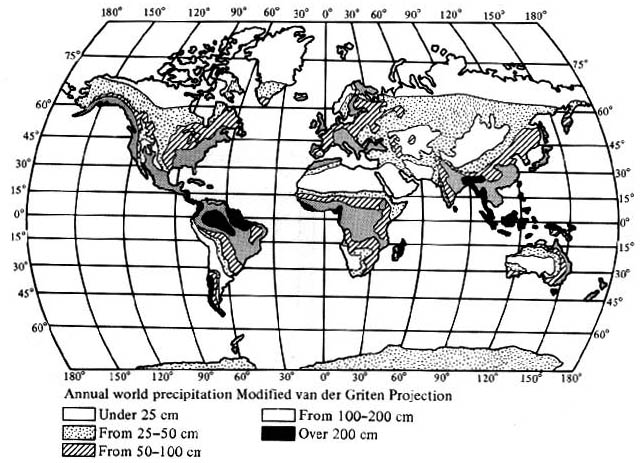
Warm air can carry more water vapor than cold air. As warm, water-laden equatorial air rises and cools adiabatically, it first becomes saturated with water at its dew point, and then its water vapors condense to form precipitation. As a result, regions of heavy rainfall tend to occur near the equator (Figure 3.4). In contrast, at the horse latitudes, as cold dry air masses descend and warm adiabatically, they take up water; such desiccating effects help to produce the earth's major deserts at these latitudes (see Figures 3.4 and 3.5). Deserts occur mainly on the western sides of continents, where cold offshore waters are associated with a blanket of cold, and therefore dry, air; westerly winds coming in off these oceans do not contain much water to give up to the descending dry air, and precipitation must therefore be scanty. The global pattern of annual precipitation shown in Figure 3.5 conforms in general outline to the expected, but there are many local anomalies and exceptions.
-
![]() Figure 3.5. Geographic distribution of average annual precipitation. Figure 3.5. Geographic distribution of average annual precipitation.
![]() [After MacArthur and Connell (1966) after Koeppen.] [After MacArthur and Connell (1966) after Koeppen.]
Local Perturbations
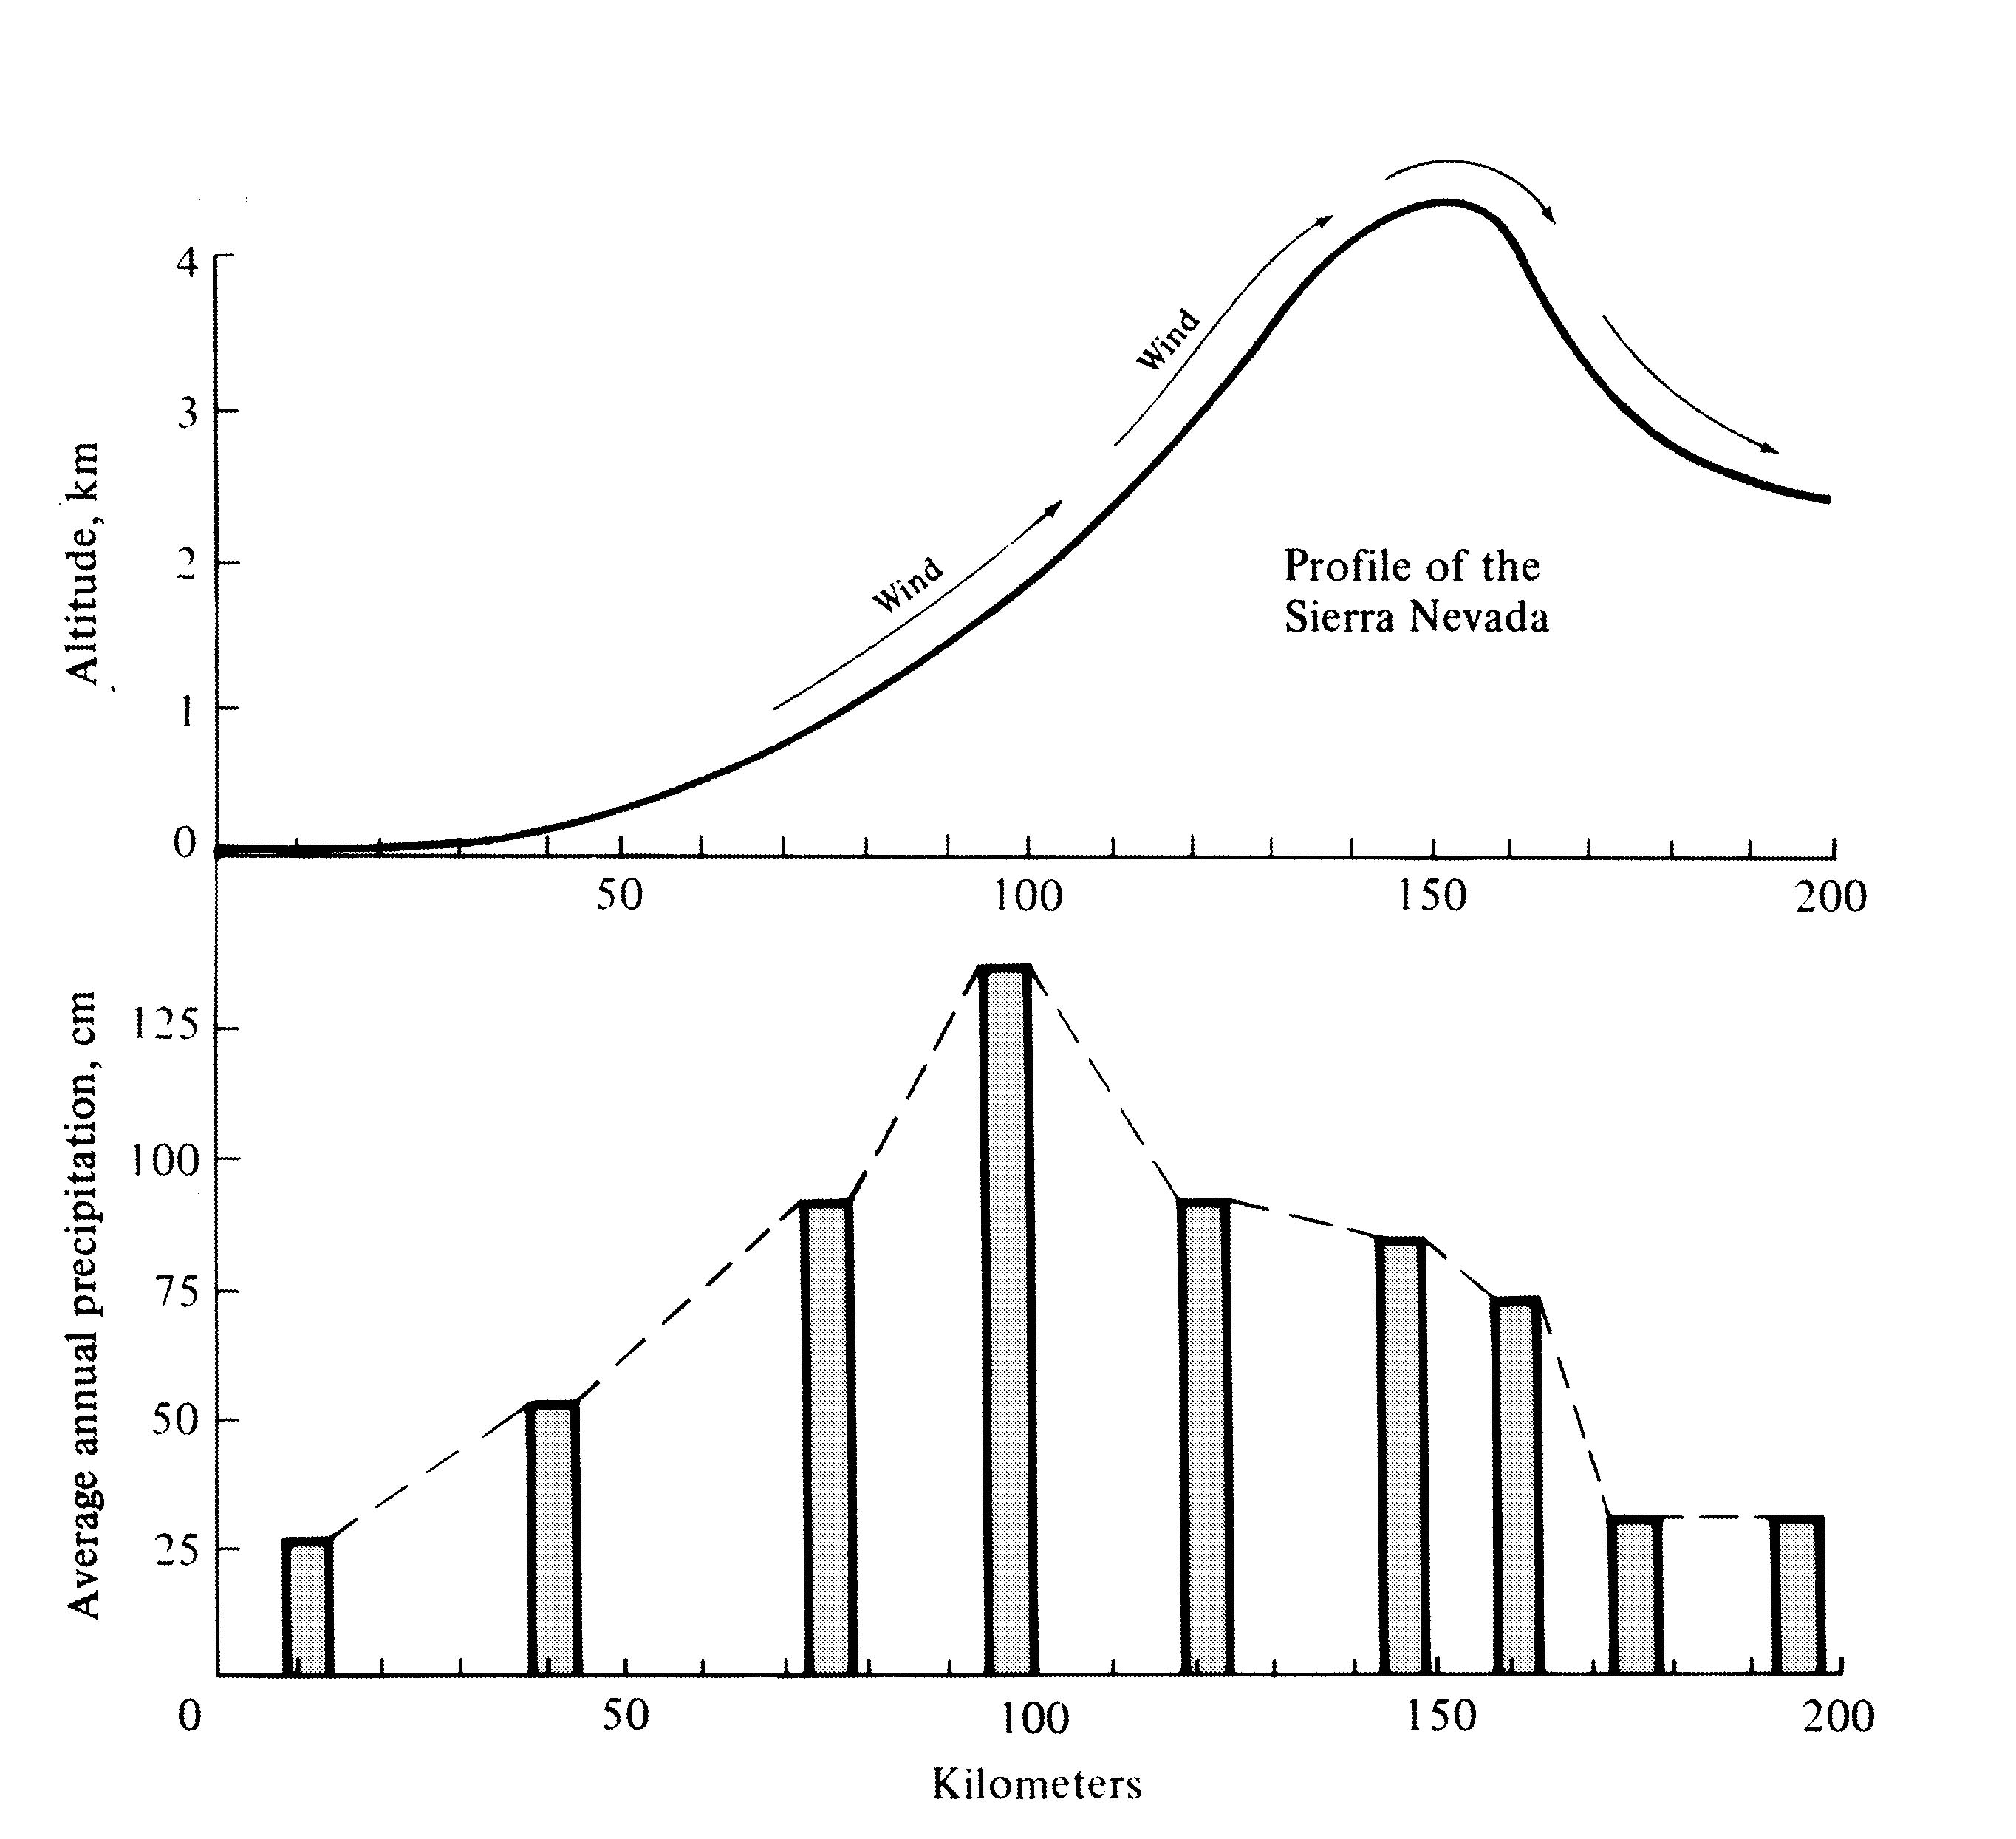
Major climatic trends are modified locally by a variety of factors, most notably by the size(s) and position(s) of nearby water bodies and landmasses and by topography (especially mountains). Ascending a mountain is, in many ways, comparable to moving toward a higher latitude. Mountains are usually cooler and windier than adjacent valleys and generally support communities of plants and animals characteristic of lower elevations at higher latitudes (100 meters of elevation corresponds roughly to 50 kilometers of latitude). In addition to this thermal effect, mountains markedly modify water availability and precipitation patterns. Water rapidly runs off a slope but sits around longer on a flatter place and soaks into the ground. For this reason, precipitation falling on a mountainside is generally less effective than an equivalent amount falling on a relatively flat valley floor. Precipitation patterns themselves are also directly affected by the presence of mountains. Consider a north-south mountain range receiving westerly winds, such as the Sierra Nevada of the western United States. Air is forced upward as it approaches the mountains, and as it ascends, it cools adiabatically, becomes saturated with water, and releases some of its water content as precipitation on the windward side of the Sierra. After going over the ridge, this same air, now cold and dry, descends, and, as it warms adiabatically, it sucks up much of the moisture available on the leeward (downwind) side of the mountains. The so-called rainshadow effect (Figure 3.6) is produced, with windward slopes being relatively wet and leeward slopes being much drier. Desiccating effects of these warm dry air masses extend for many miles beyond the Sierra and help to produce the Mojave Desert in southern California and Nevada.
-
Figure 3.6. Illustration of the "rainshadow" effect of the Sierra Nevada in central California.
Water has a high specific heat; that is, a considerable amount of heat energy is needed to change its temperature. Conversely, a body of water can give up a relatively large amount of heat without cooling very much. A result of these heat "sink" attributes is that large bodies of water, particularly oceans, effectively reduce temperature changes of nearby landmasses. Thus, coastal "maritime" climates are distinguished from inland "continental" climates, with the former being much milder and less variable. Large lakes, such as the Great Lakes, also decrease thermal changes on adjacent landmasses and produce a more constant local temperature.
Variations in Time and Space
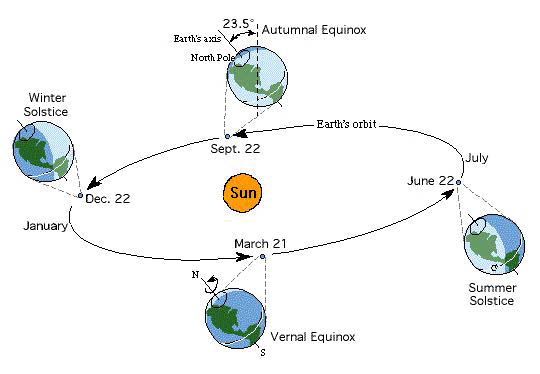
The seasons are produced by the annual elliptical orbit of the earth around its sun and by the inclination of the planet's axis relative to this orbital plane (Figure 3.7). These orbital movements do not repeat themselves exactly but follow a complex celestial periodicity measured on a time scale of many thousands of years (Milankovitch cycles).
For historical reasons, these movements and patterns have been described from the point of view of the Northern Hemisphere, although by symmetry the same events occur some six months out of phase in the Southern Hemisphere. Twice each year, at the vernal equinox (March 21) and the autumnal equinox (September 22), solar light beams intercept the earth's surface perpendicularly on the equator (i.e., the sun is "directly overhead" at its zenith and equatorial shadows point exactly east to west).
-
Figure 3.7. Diagram of the earth's annual elliptical orbit around the sun, which produces the seasons.
[After MacArthur and Connell (1966).]
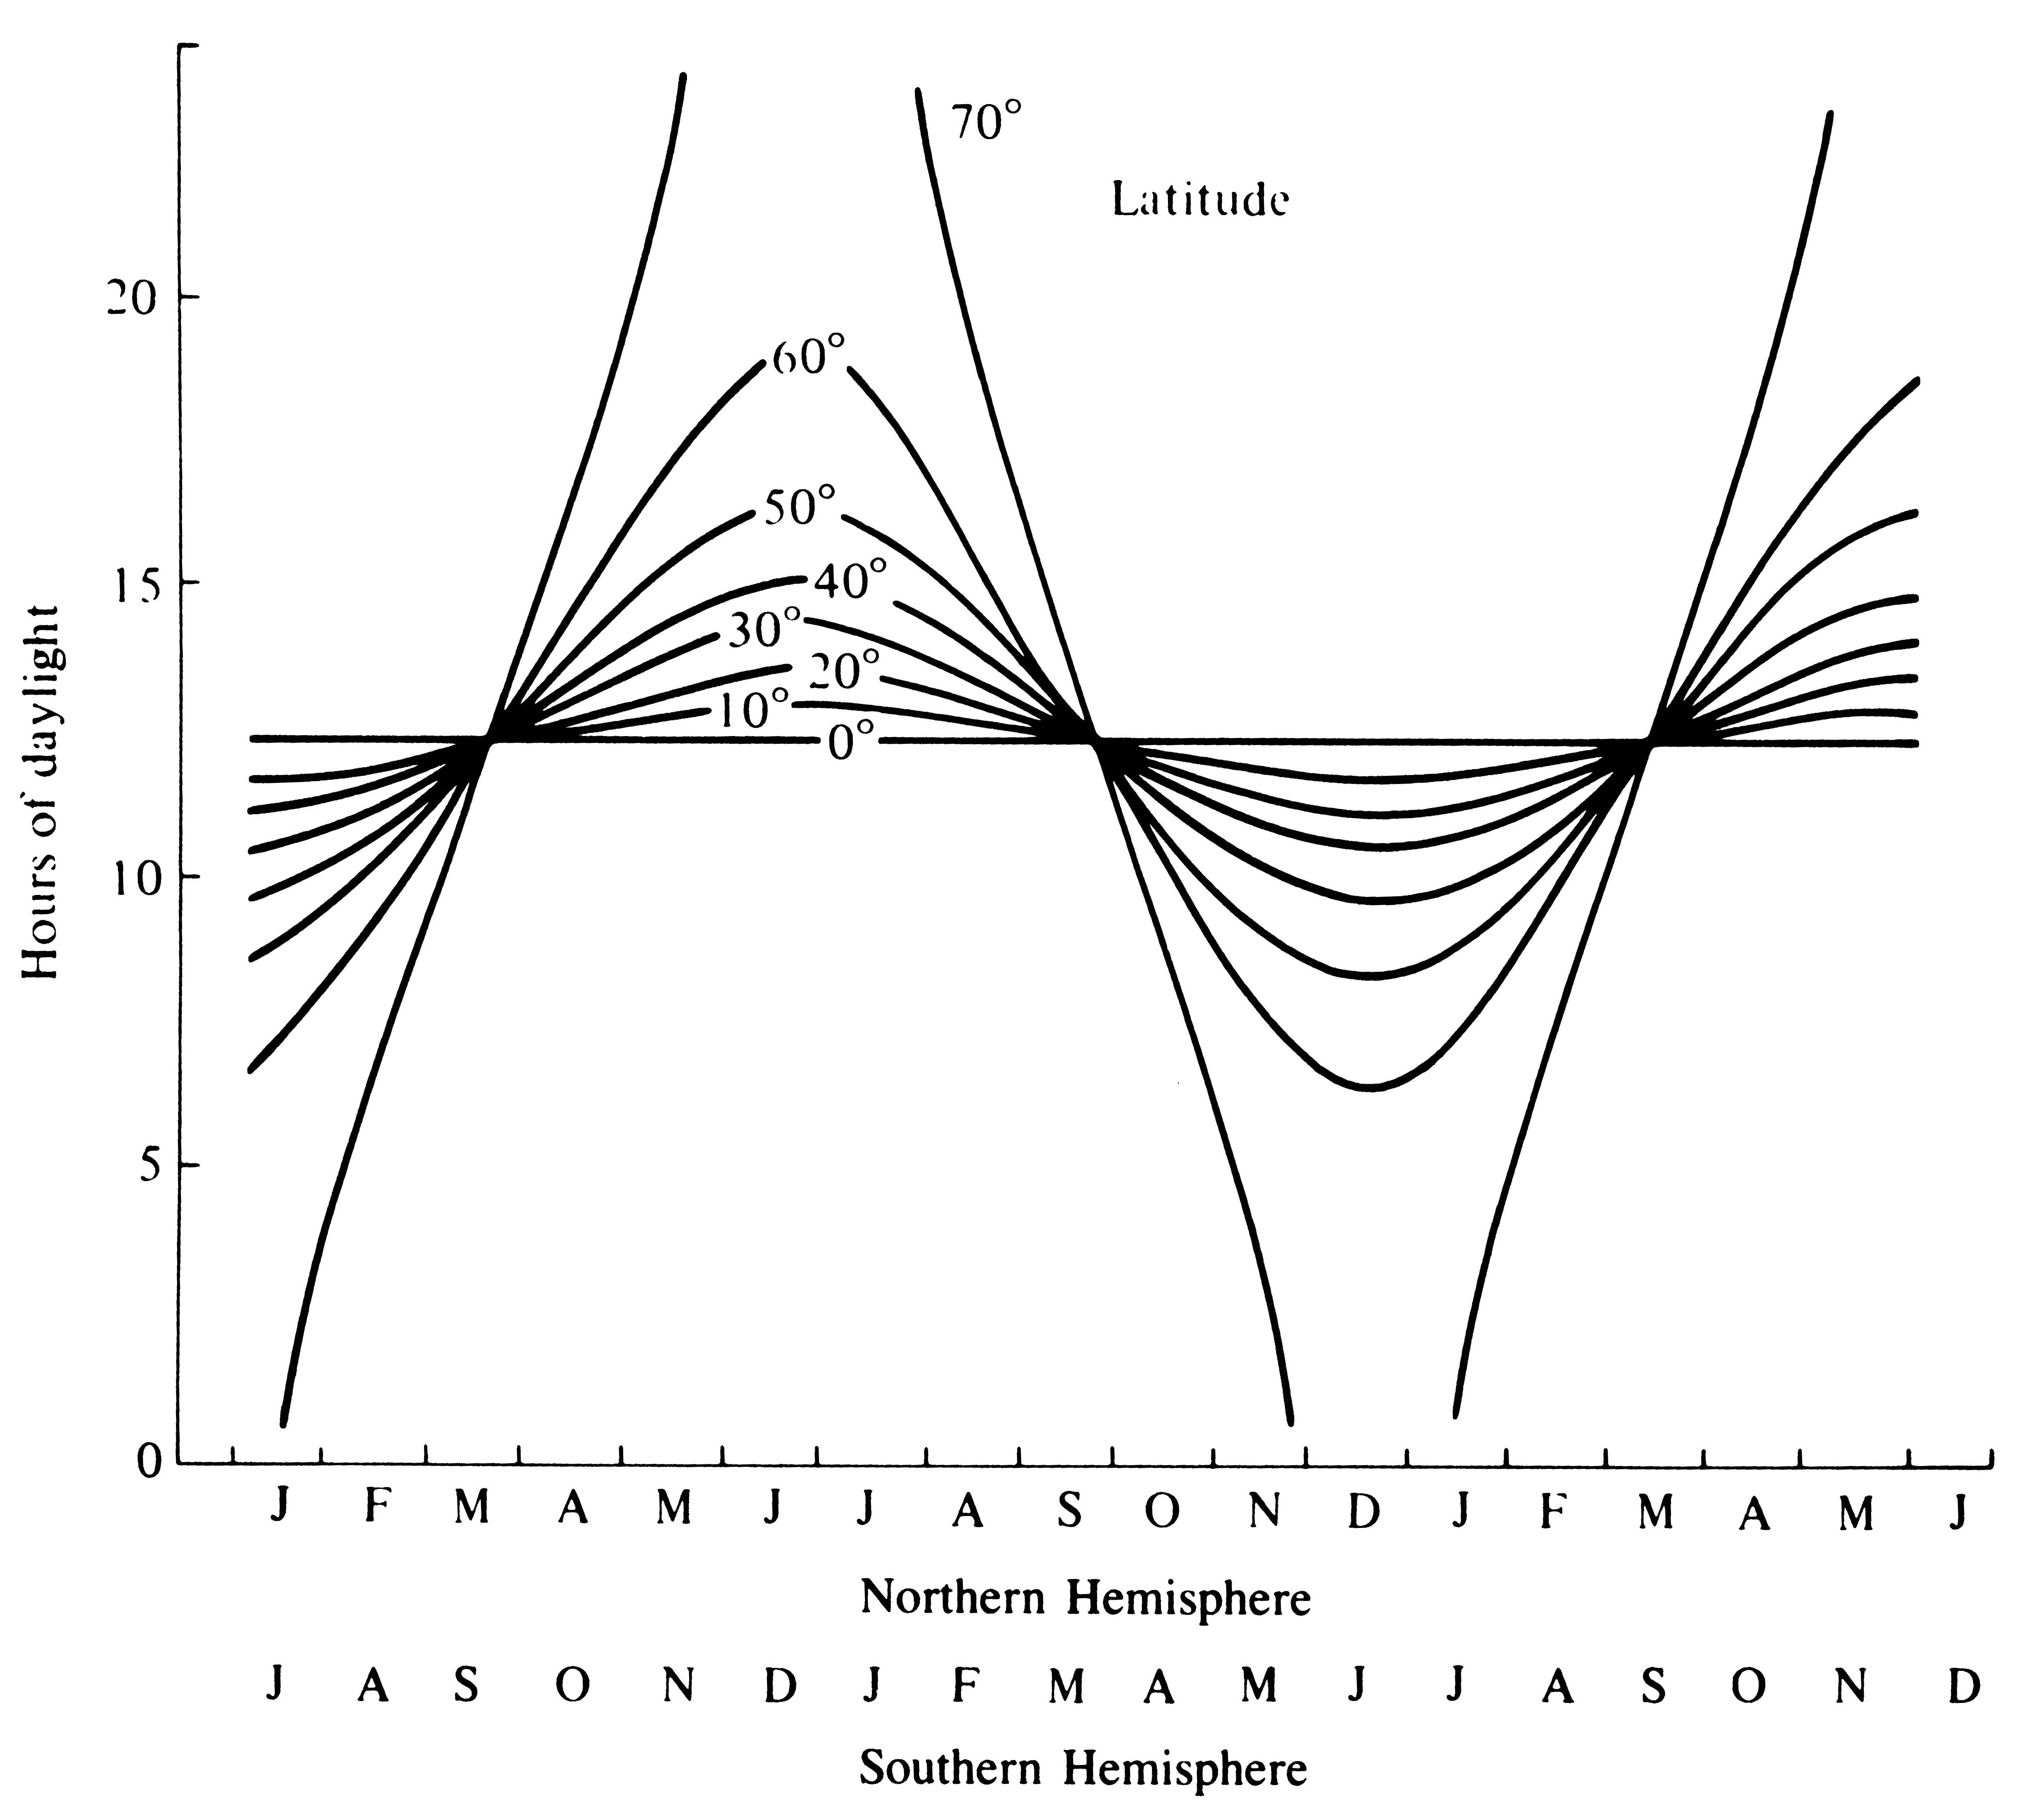
At two other times of year, the summer solstice (June 22) and the winter solstice (December 22), the earth's axis is tilted maximally with respect to the sun's rays. Viewed from the Northern Hemisphere, the axis at present inclines approximately 23.5° toward the sun during the summer solstice and 23.5° away from it during the winter solstice (this angle of inclination itself varies cyclically between 22° and 24.5°, with a periodicity of about 41,000 years). At each of the solstices, rays of light hit the surface perpendicularly (the sun is at its zenith) near the Tropic of Cancer (23°N) and the Tropic of Capricorn (23°S), respectively. At summer solstice, the North Pole is in the middle of its six-month period of sunlight (the "polar summer"). The excess of daylight in summer is exactly balanced by the winter deficit, so the total annual period of daylight is precisely six months at every latitude; the equator has invariate days of exactly 12 hours duration, whereas the poles receive their sunshine all at once over a six-month interval and then face six months of twilight and total darkness. Day length is one of the most dependable indicators of seasonality and many temperate zone plants and animals rely on photoperiod as an environmental cue (Figure 3.8).
-
Figure 3.8. Seasonal changes in photoperiod at different latitudes. [After Sadleir (1973).]
Of course, prevailing winds and ocean currents are not static, as suggested by Figures 3.2 and 3.3; in fact, they vary seasonally with the earth's movement about its sun (Figure 3.9). The latitudinal belt receiving the most solar radiation (the thermal equator) gradually shifts northward and southward between latitudes 23°S and 23°N; moreover, latitudinal belts of easterlies and westerlies also move northward and southward with the seasons, producing seasonal weather changes at higher latitudes. Because of the earth's spherical shape, seasonal changes in insolation increase markedly with increasing latitude.
Although temperatures are modified by prevailing winds, topography, altitude, proximity to bodies of water, cloud cover (Figure 3.10), and other factors, annual marches of average daily temperatures at any given place nevertheless closely reflect earth's movement around the sun. Thus, average daily temperatures on the
equator change very little seasonally, whereas those at higher latitudes usually fluctuate considerably more; moreover, the annual range in temperature is
also much greater in the temperate zones (Table 3.1).
Annual patterns of precipitation also reflect earth's orbital movements (Figure 3.11), although precipitation patterns are perhaps modified locally more easily than thermal patterns. At very low latitudes, say, l0°S to l0°N, there are often two rainfall maxima each year (Figure 3.12a), one following each equinox as the region of rising air (the thermal equator) passes over the area. Thus, the sun's passing over these equatorial areas twice each year produces a bimodal annual pattern of precipitation. Bimodal annual precipitation patterns also occur in other regions at higher latitudes, such as the Sonoran Desert in Arizona (Figure 3.12b), but for different
reasons. However, not all equatorial areas have such a rainfall pattern, and some have only one rainy season each year (Figure 3.12c).
-
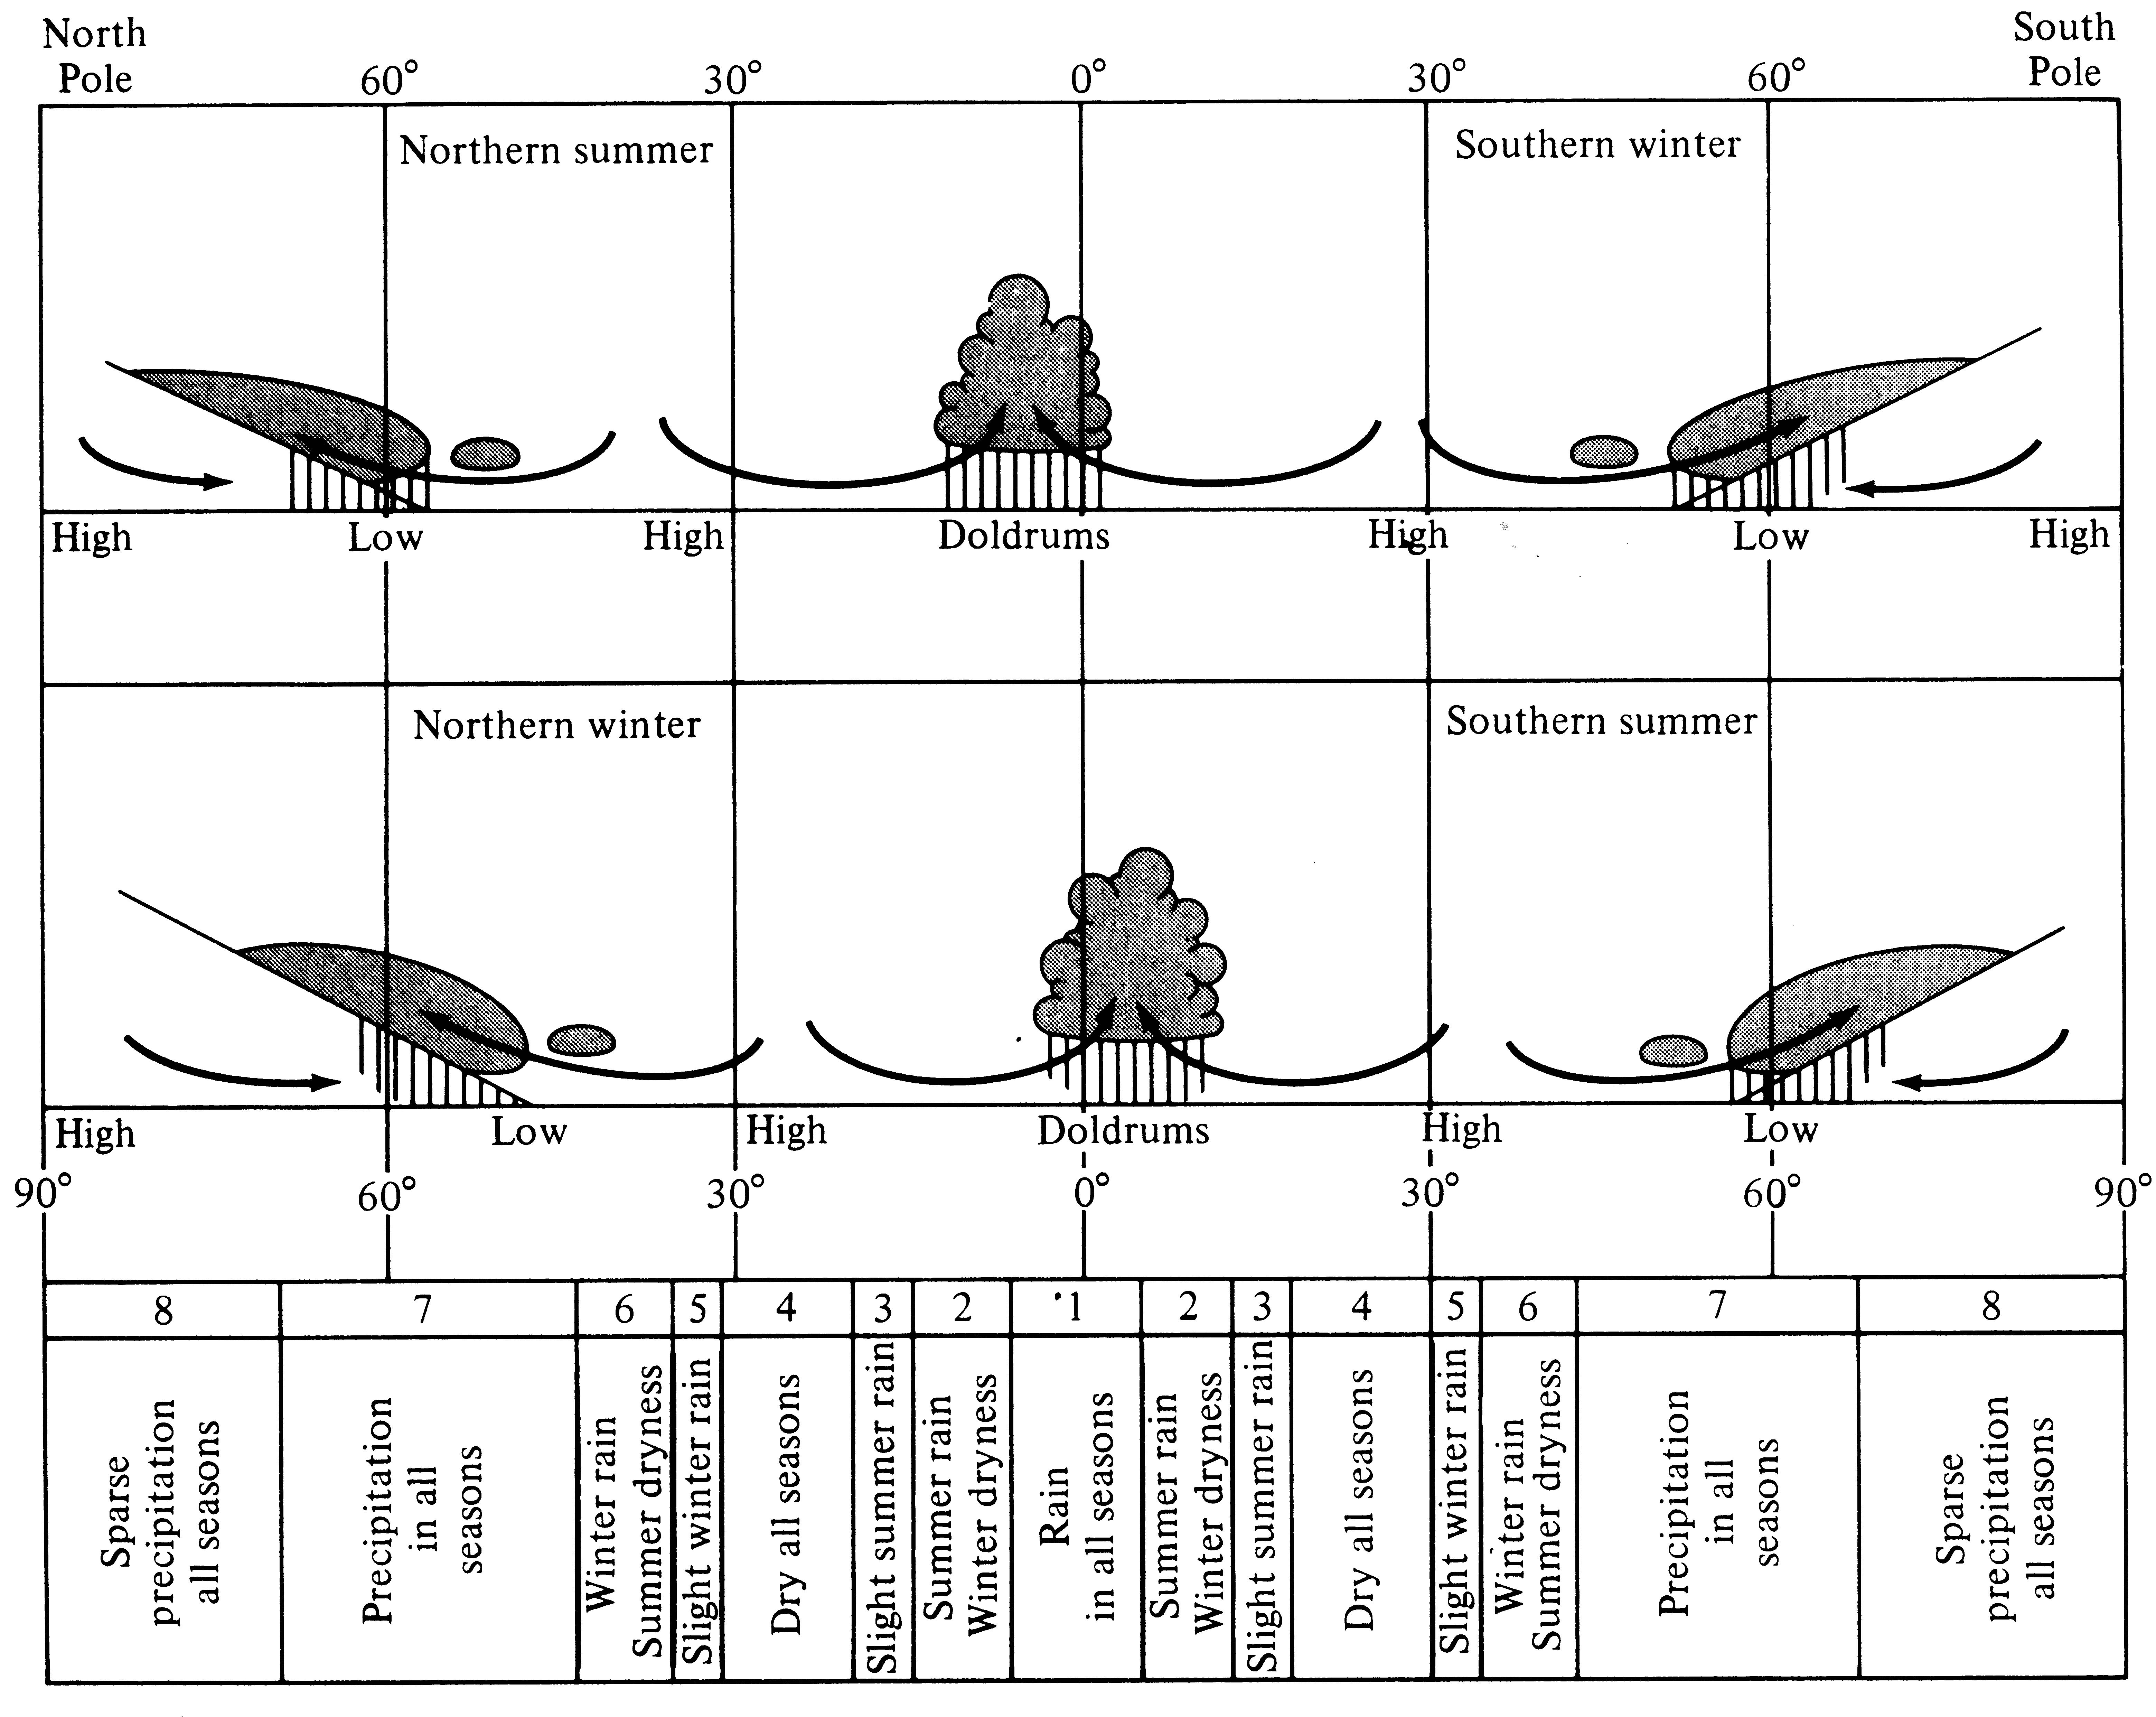
Figure 3.9. Precipitation zones vary latitudinally in a more-or-less regular fashion, as indicated. [After Haurwitz and Austin (1944).]
During summer, air masses in the central parts of continents at high latitudes tend to warm faster than those around the periphery, which are cooled somewhat by nearby oceans. As hot air rises from the center of continents, a "low" pressure area is formed and cooler, but still warm and water-laden, coastal air can be drawn in off the oceans and coastlines. When this moist air is warmed over the land, it rises, cools adiabatically, and releases much of its water content on the interiors of continents. Thus, continental, in contrast to coastal, climates are often characterized by summer thunderstorms (Figure 3.12d). In winter, as the central regions of continents cool relative to their water-warmed edges, a "high" pressure area develops and winds reverse, with cold dry air pouring outward toward the coasts.
High pressure areas also arise during hot summers in the interior of continents forming a dome of hot air that holds in heat.
-
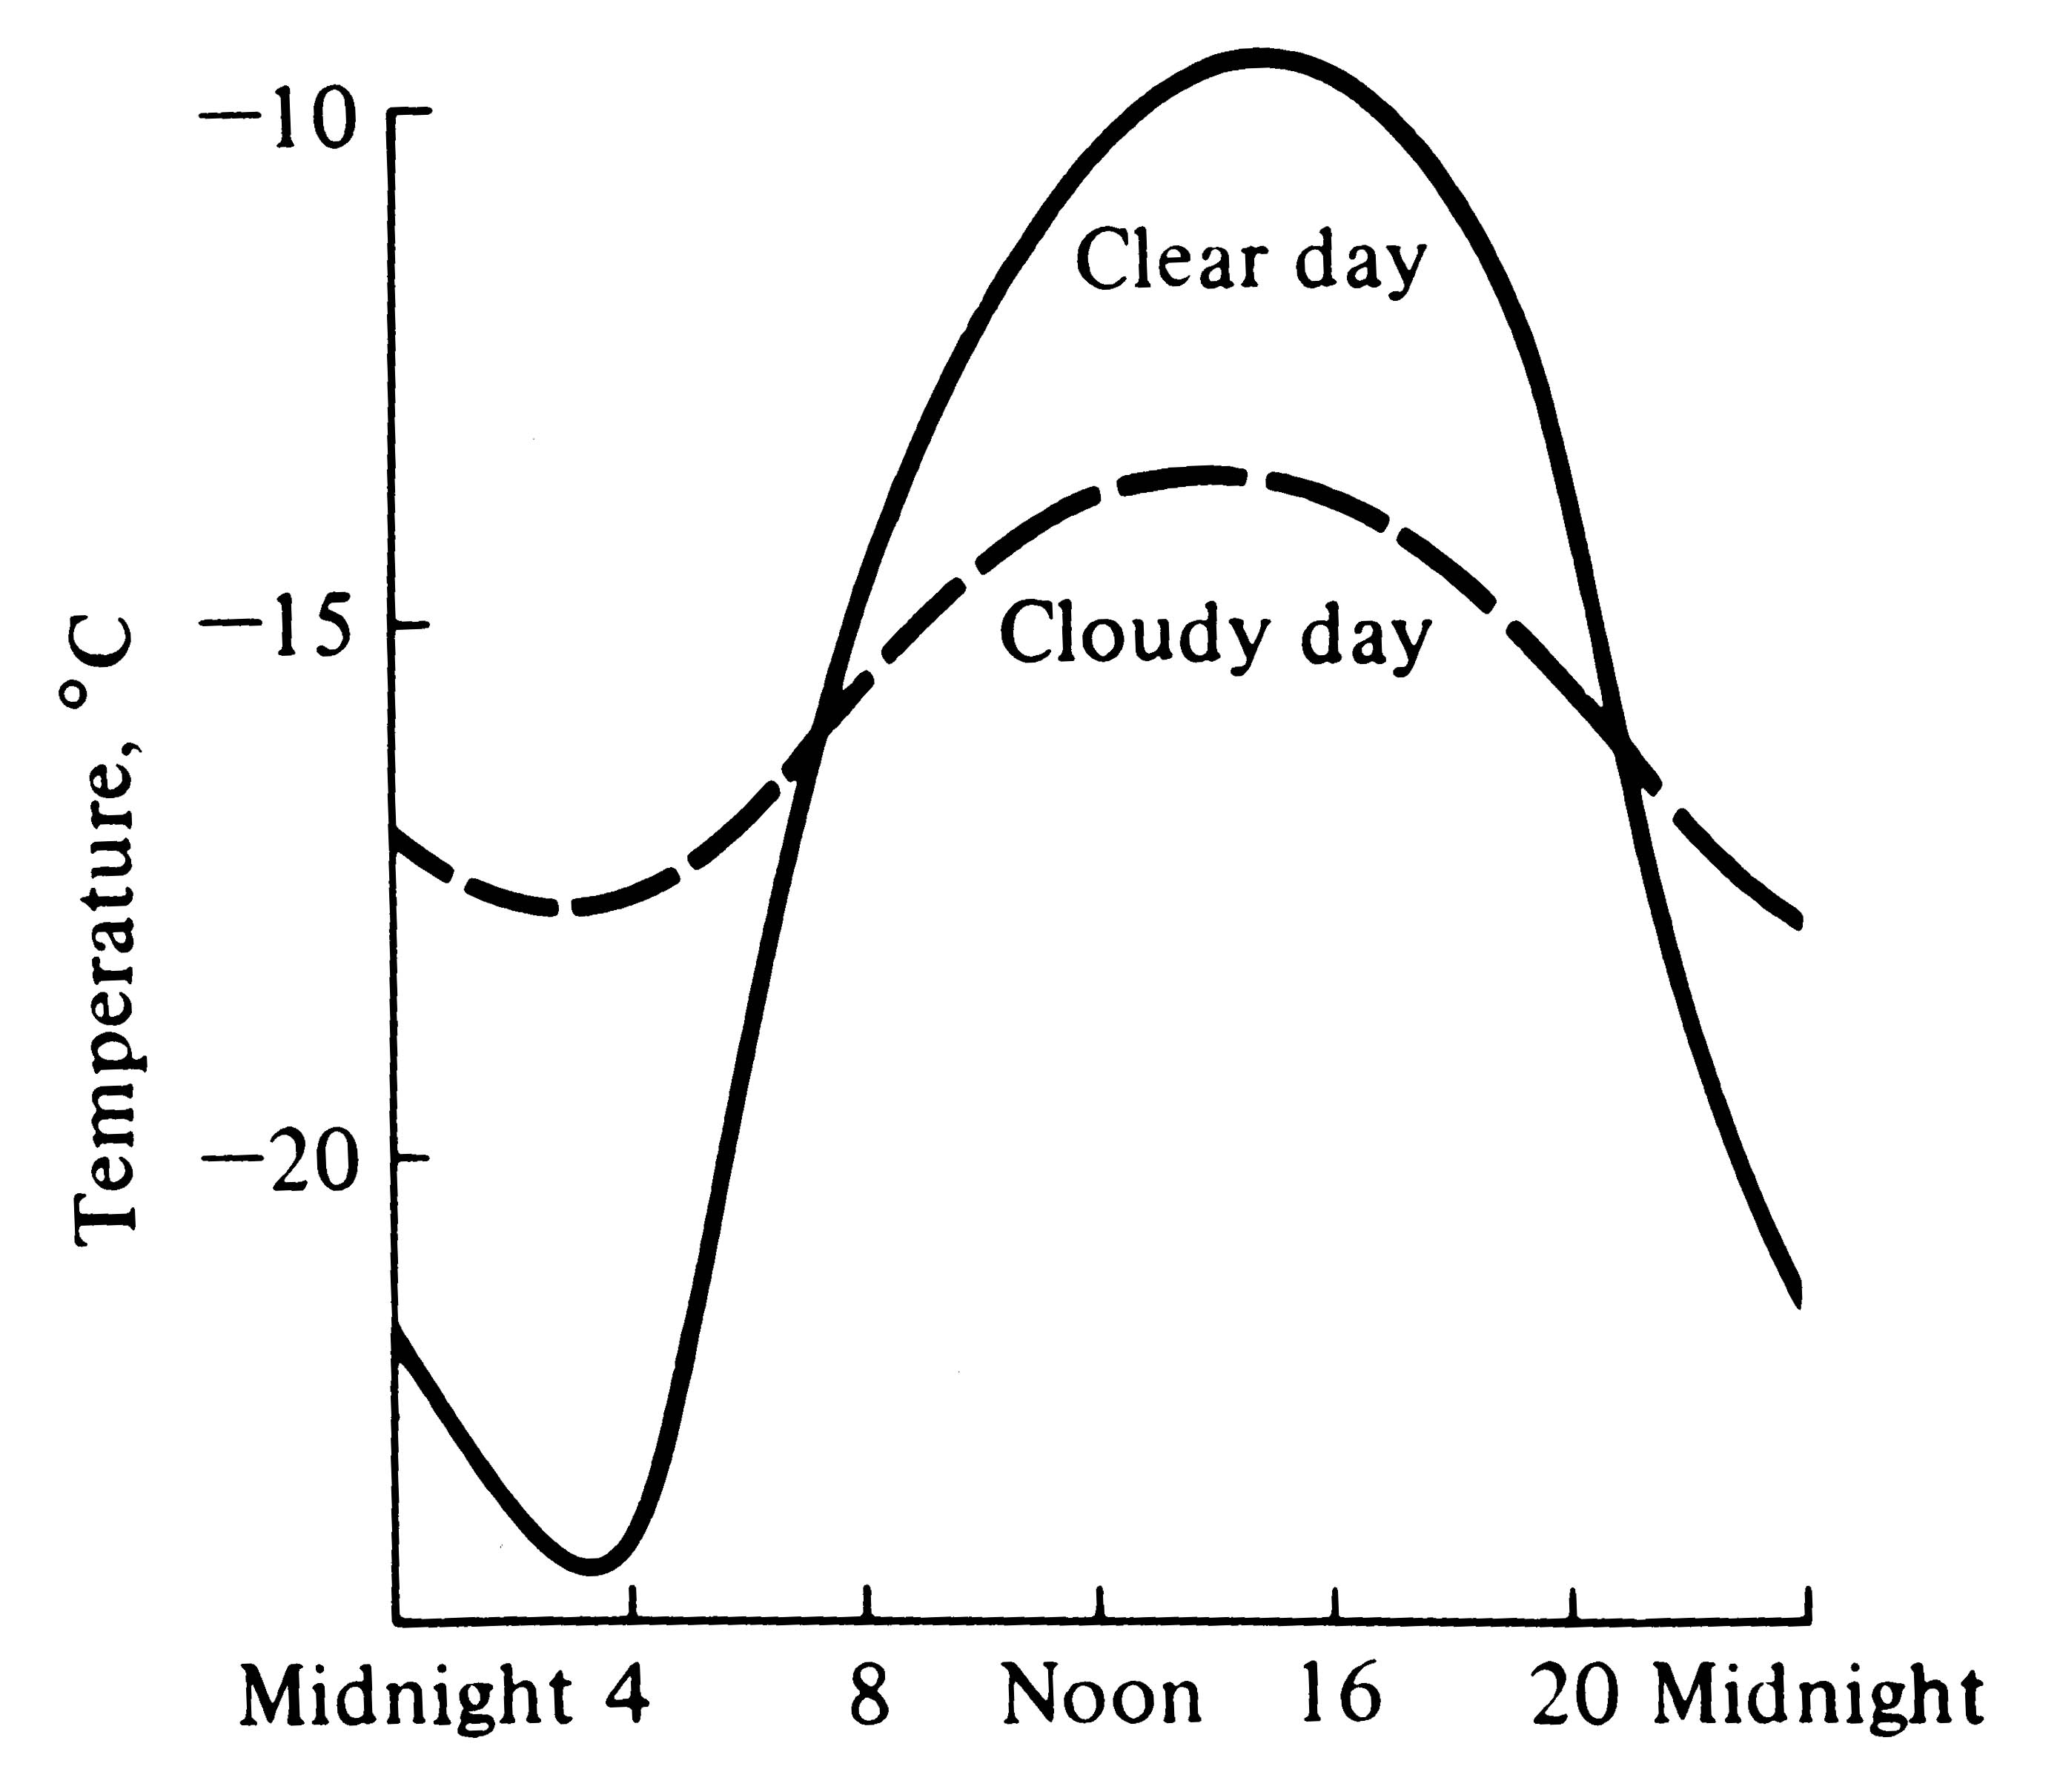
Figure 3.10. Cloud cover reduces both the amplitude and the extremes of the daily march of temperature. [After Haurwitz and Austin (1944).]
-
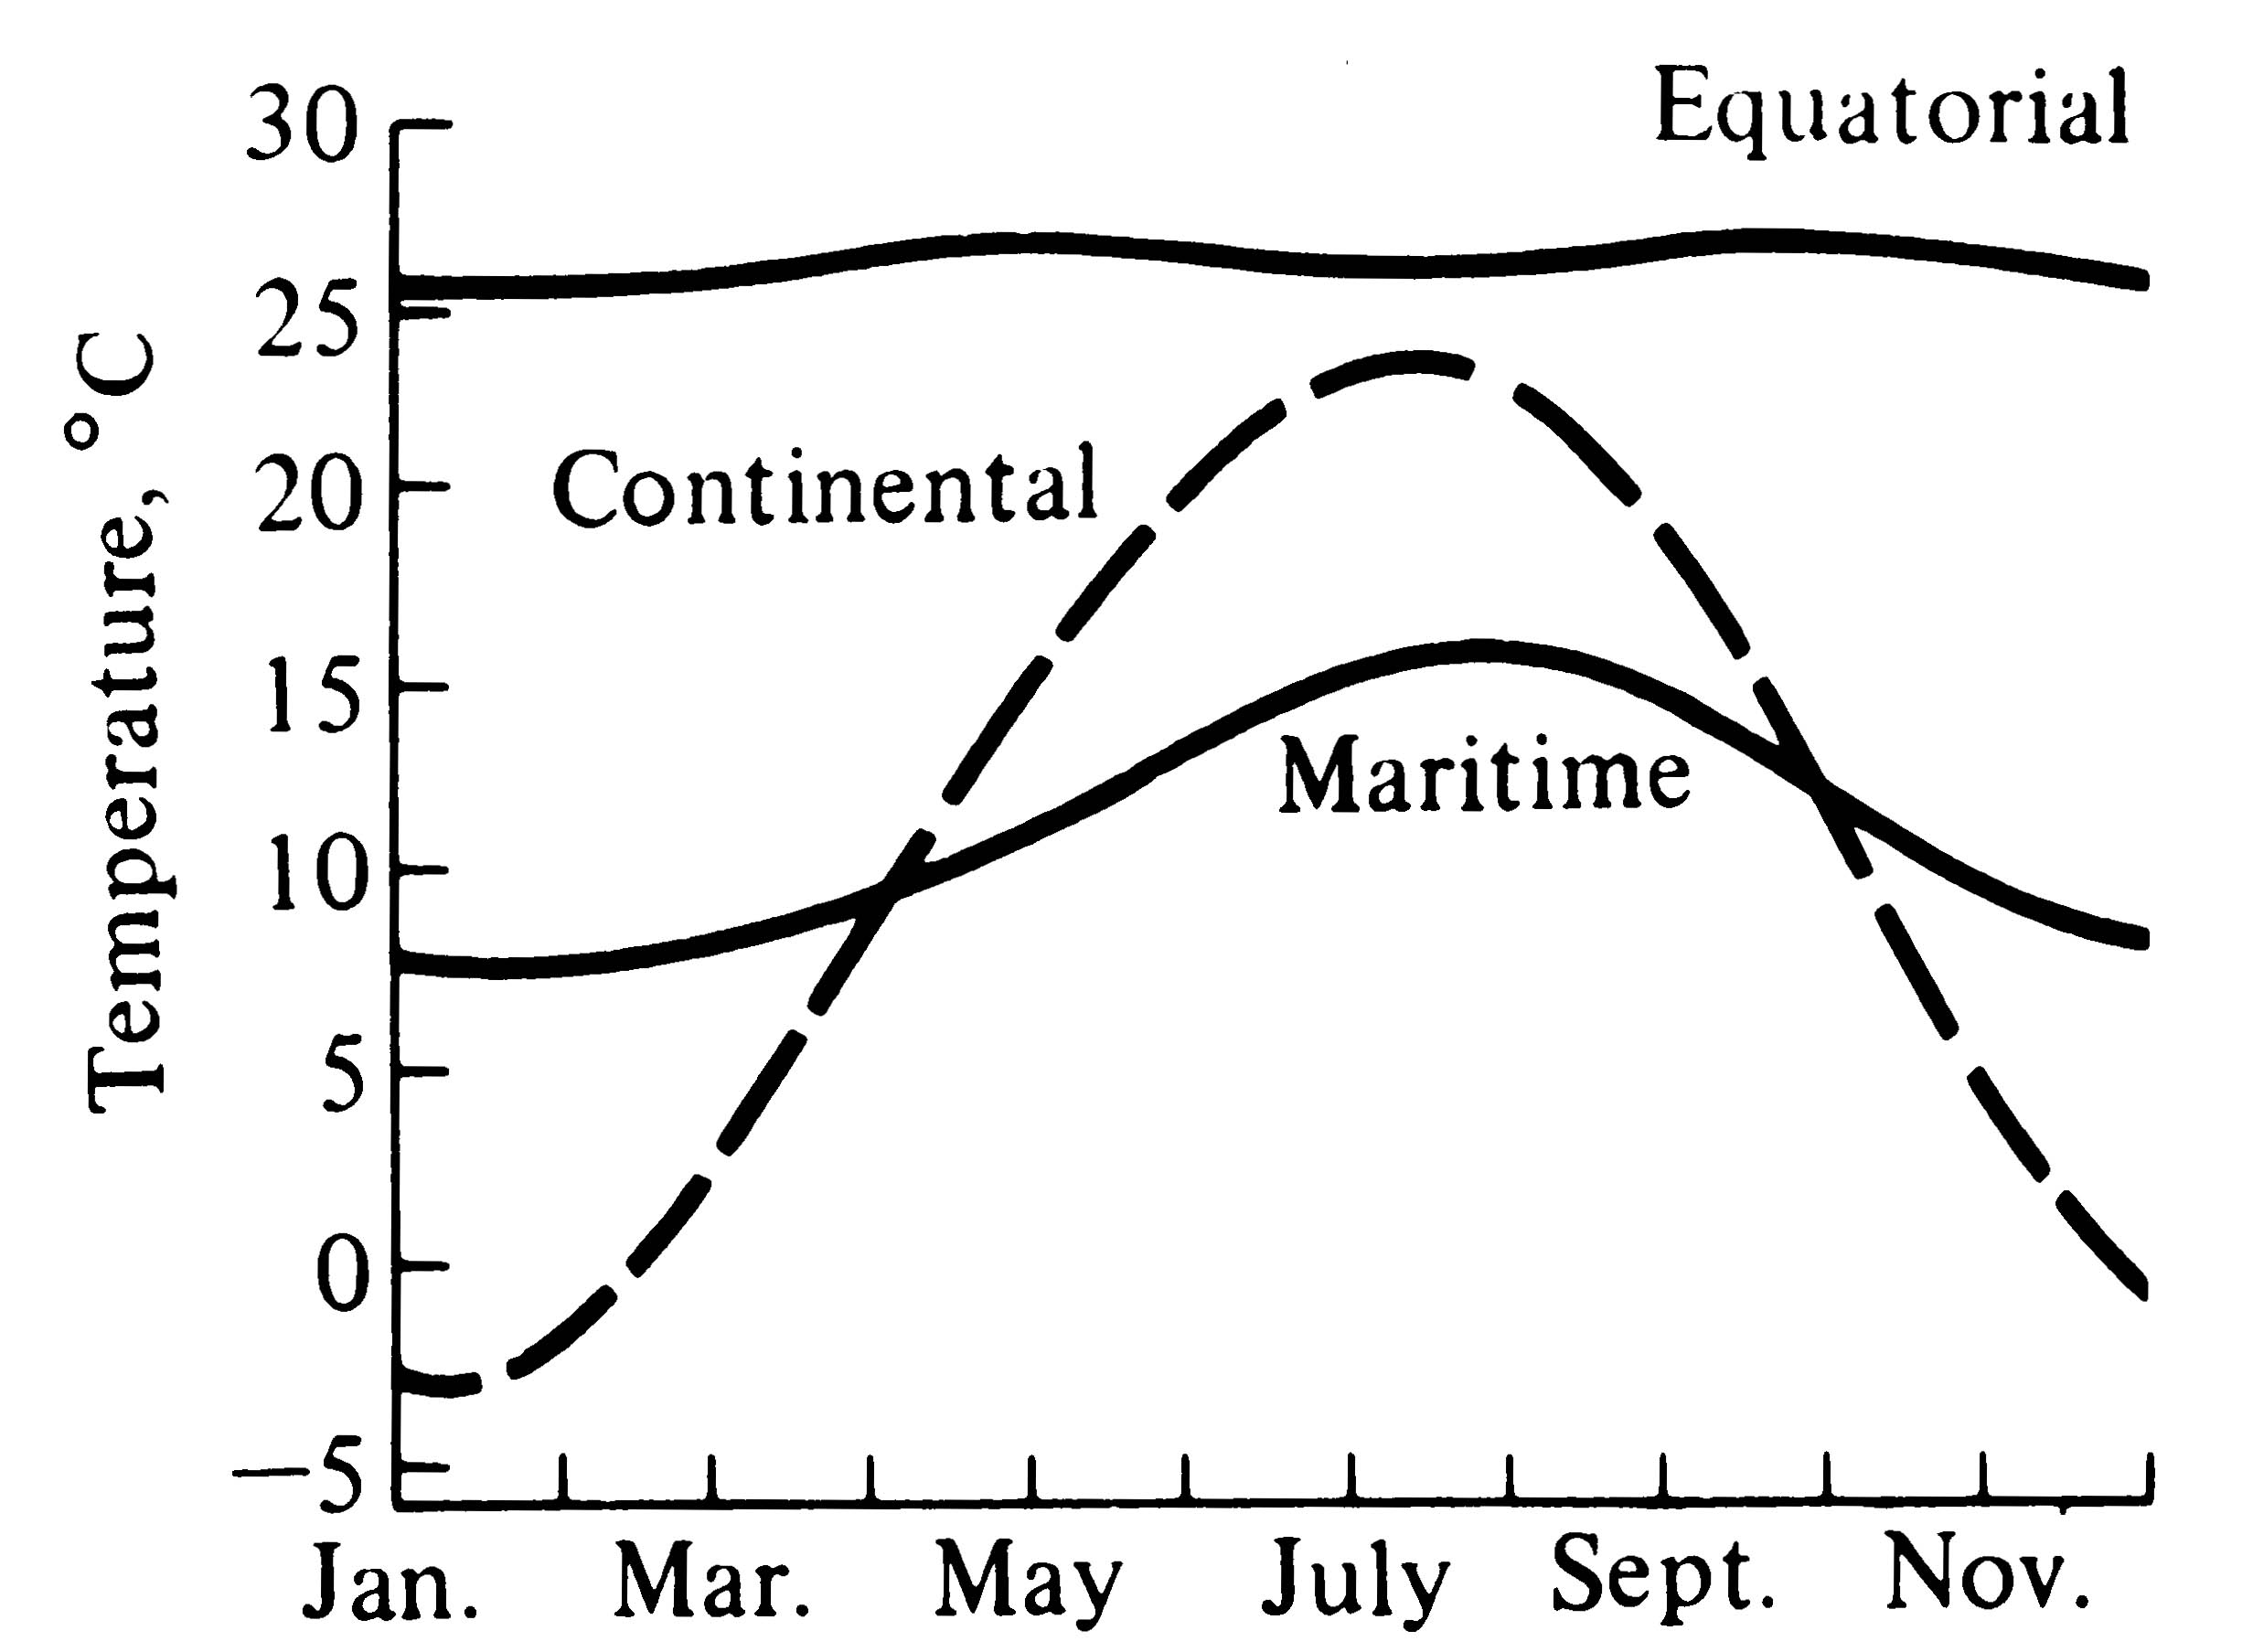
Figure 3.11. Annual marches of average daily temperature at an equatorial locality (Batavia) and two temperate areas, one coastal (Scilly) and one continental (Chicago). [After Haurwitz and Austin (1944).]
A weather "front" is produced when a cold (usually polar) air mass and a warm air mass collide. The warmer lighter air is displaced upward by the heavy cold air; as this warm air rises, it is cooled adiabatically, and provided it contains enough water vapor, reaches its dewpoint, forming clouds and eventually producing precipitation. Such fronts typify the boundaries between the polar easterlies and the midlatitude westerlies, which move north to south with the seasons as shown in Figure 3.9.
-
Figure 3.12. Annual marches of average yearly precipitation from eight selected localities (see text). (a) Bimodal equatorial rainfall. (b) Bimodal annual precipitation pattern of the Sonoran Desert. (c) Unimodal annual rainfall pattern of an equatorial area. (d) Typical continental summer rainfall regime. (e) Coastal area with winter precipitation. (f) Typical maritime rainfall regime with more winter precipitation than summer rain. (g) The annual march of precipitation in eastern North America is distributed fairly evenly over the year. (h) An area with a pronounced summer drought that would support a chaparral vegetation. [After Haurwitz and Austin (1944).]
The seasonality of coastal rainfall is affected by the differential heating of land and water in another, almost opposite, way. At high latitudes, say, 40° to 60°, land-masses cool in winter and become much colder than offshore oceans; along the west coasts of continents, water-rich westerly winds coming in off such a relatively warm ocean are rapidly cooled when they meet a cold landmass and hence deposit much of their moisture as cold winter rain and/or snow along the coast (Figure 3.12e). Maritime climates typically have precipitation through the entire year, with somewhat more during the winter months (Figure 3.12f). As a result of prevailing westerly winds at latitudes 30° to 60°, east coasts at these latitudes have continental climates, whereas west coasts have maritime climates. In eastern North America, precipitation is spread fairly evenly over the year (Figure 3.12g). Areas with a long summer drought and winter rains (Figure 3.12h) typically support a vegetation of chaparral.
A convenient means of graphically depicting seasonal climates is the "climograph," a plot of average monthly temperature against average monthly precipitation (Figure 3.13). Although such graphs do not reflect year-to-year variability in climate, they do show at a glance the changes in both temperature and precipitation within an average year, as well as the season(s) during which the precipitation usually falls. (Without actually identifying points by months, however, spring cannot be distinguished from fall since both are seasons of moderate temperatures -- hence the arrows in Figure 3.13.) Exactly analogous plots are often made for any two physical variables, such as temperature versus humidity, or temperature versus salinity in aquatic systems (Figure 3.14). Many other variables of biological importance, such as acidity (pH) and dissolved phosphorus or nitrogen, can be treated similarly. When coupled with information on the tolerance limits of organisms, climographs and their analogues can be useful in predicting responses of organisms to changes in their physical environments (Figure 3.15).
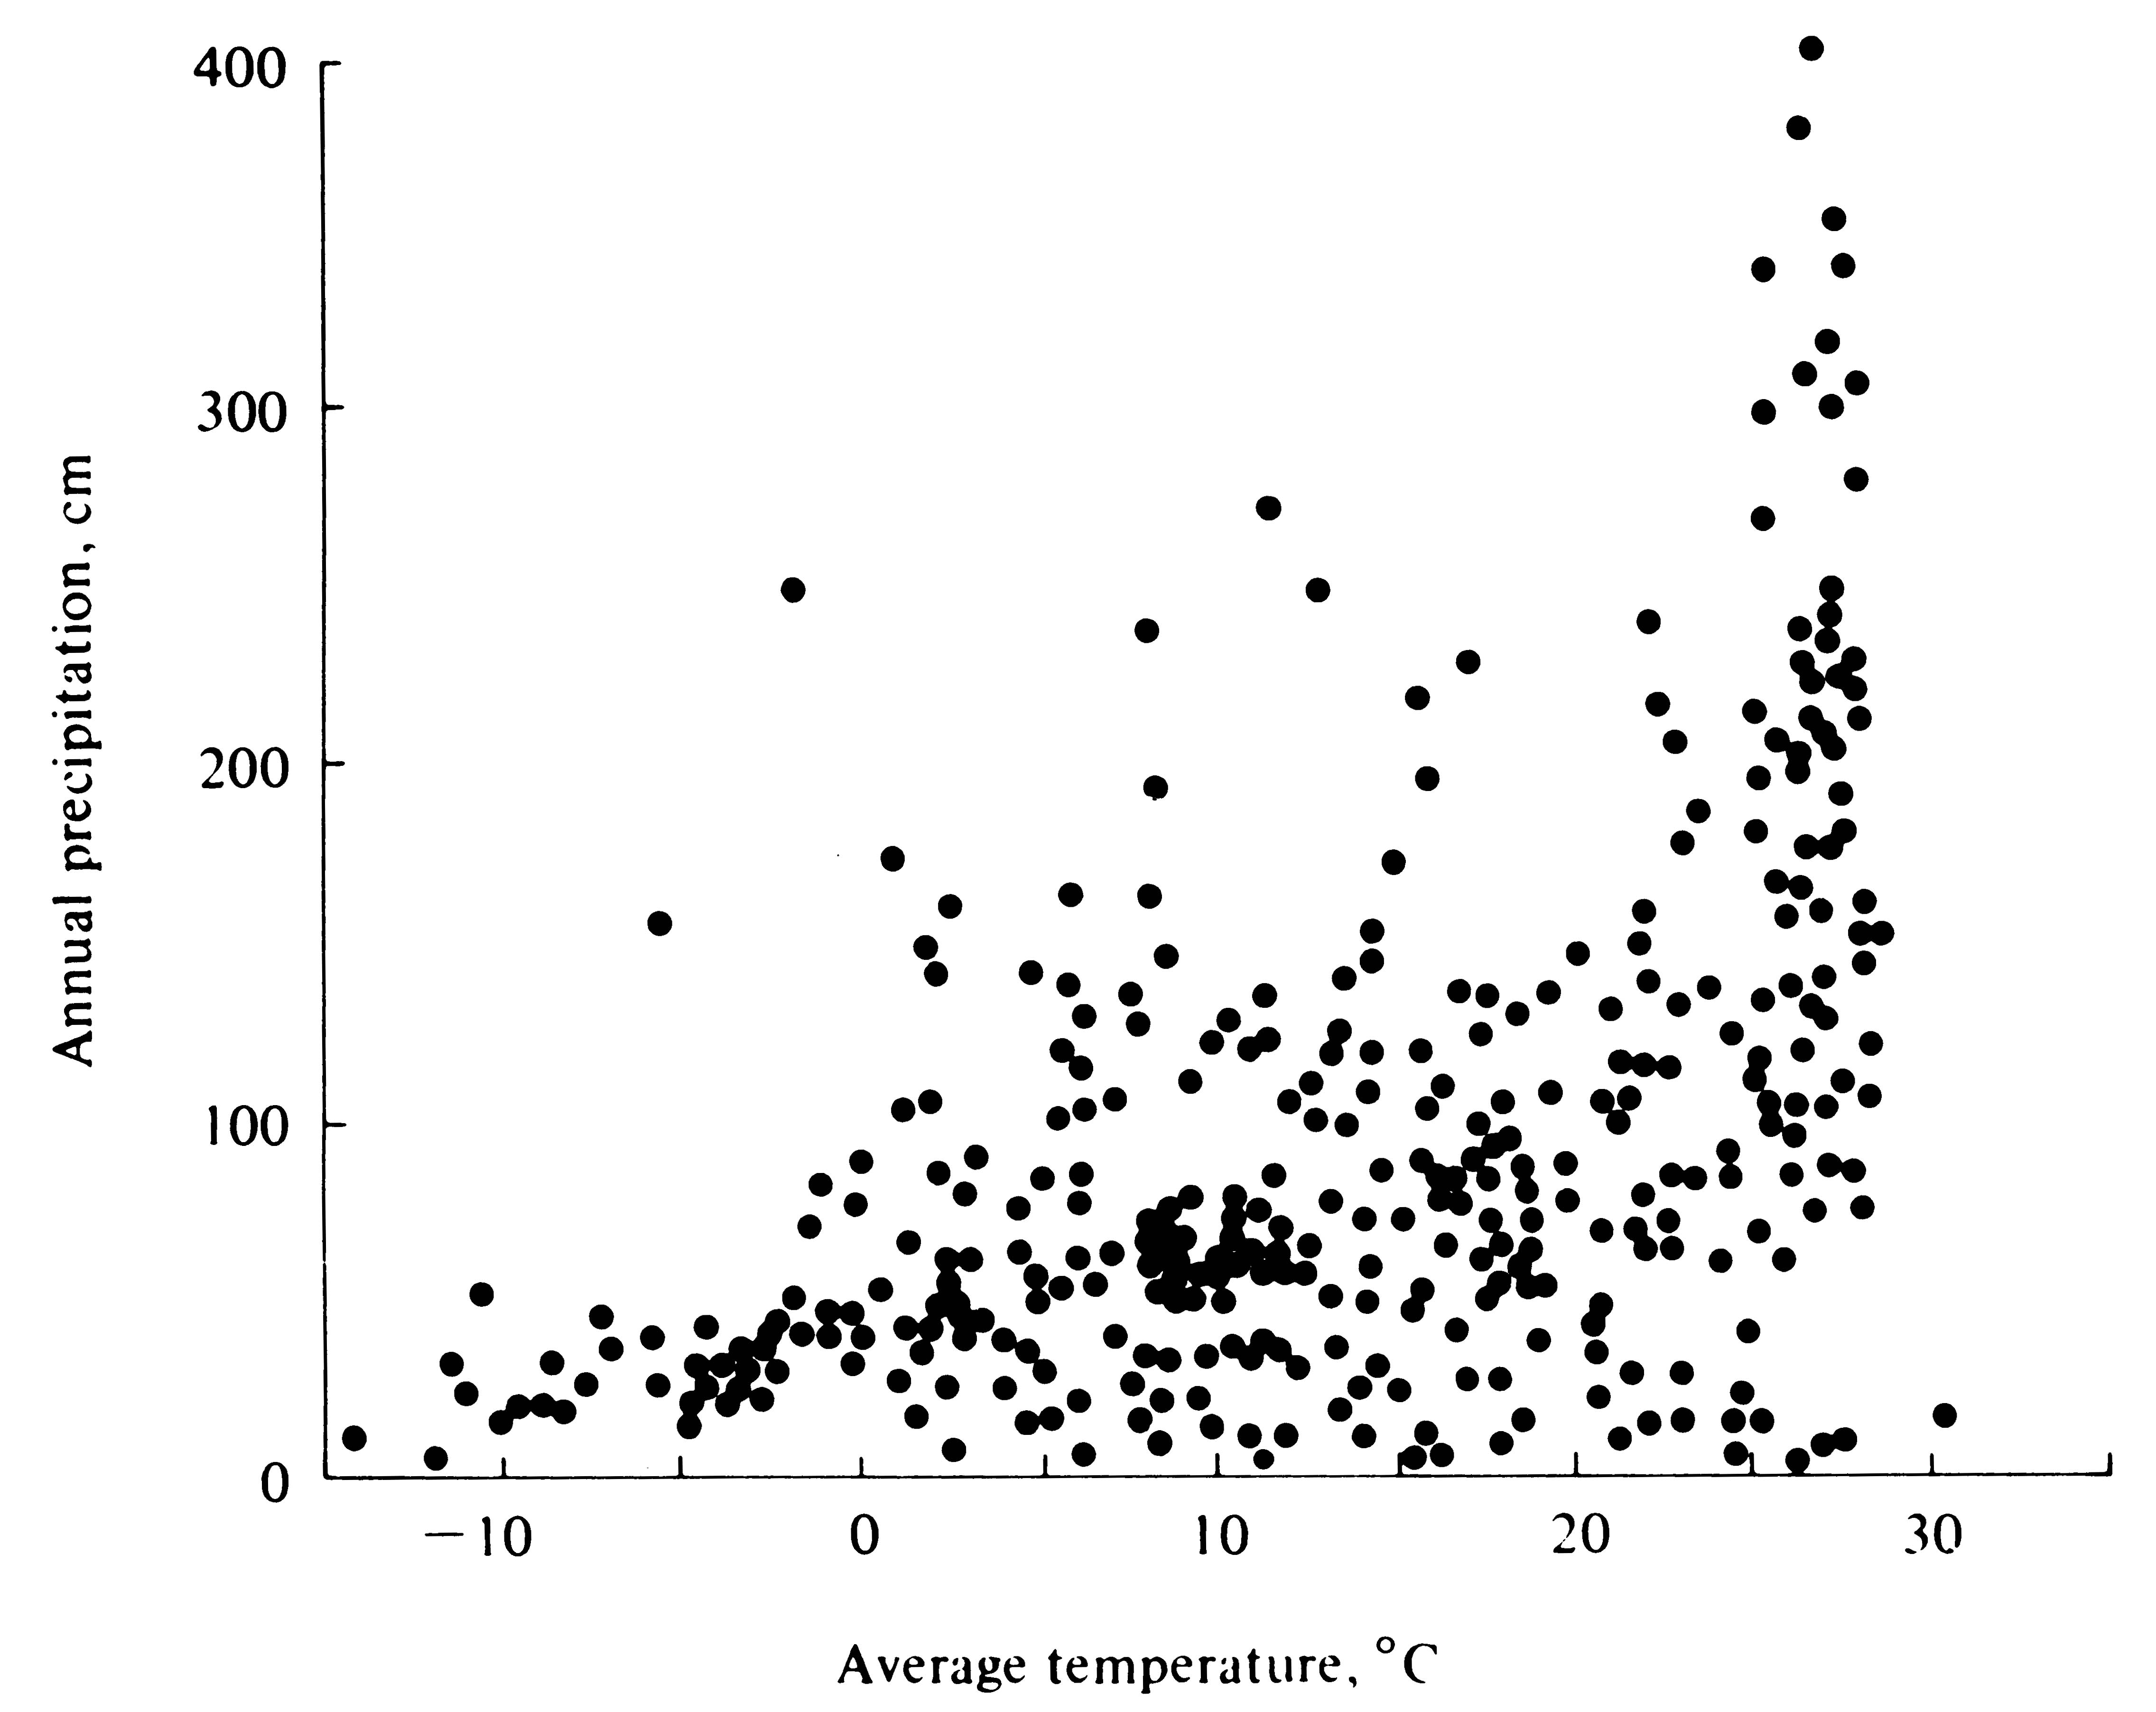
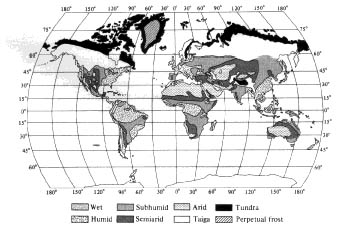
Very cold climates are usually dry, whereas warmer regions show a wide range of average annual precipitation (Figure 3.16). Although an infinite number of different types of climates exist, attempts have been made to classify them. One scheme (Köppen's) recognizes five major climatic types (as well as many minor ones): tropical rainy, dry, warm temperate rainy, cool snow forest, and polar. Another classification is shown in Figure 3.17.
-
Figure 3.13. Climographs for eight different areas with different vegetation types. [After Smith (1940).]
-
Figure 3.14. Graphs of average monthly temperature versus salinity of some estuarine and marine waters; seasonal variation is great in the brackish waters, whereas salinity varies little in true oceanic waters. [After Odum (1971) after Hedgepeth.]
-
Figure 3.15. Two plots of temperature against moisture. (a) Climographs for an area in Montana where the Hungarian partridge was introduced successfully and a Missouri locality where its introduction failed, compared to the average climatic conditions of its European geographic range. Apparently Missouri summers are too hot and/or too wet for these birds. (b) Plots of temperature versus relative humidity in 1927 and 1932 in Israel superimposed on optimal (inner rectangle) and favorable (outer rectangle) conditions for the Mediterranean fruit fly. [Note that as drawn these rectangles assume no interaction between temperature and humidity; in actuality the edges would presumably be rounded due to the principle of allocation (see also Chapter 5).] Damage to fruit crops by these flies was much greater in 1927 than in 1932. [After Odum (1959).]
-
Figure 3.16. Average annual temperature and annual precipitation for
many localities scattered more or less evenly over the land area of the earth. [Adapted from Ricklefs
(1973) based on data of Clayton. By permission of the Smithsonian Institution Press, from Smithsonian
Misc. Col. 79, World Weather Records. H. H. Clayton, Smithsonian Institution, Washington, D.C., 1927.]
-
Figure 3.17. Geographic distribution of the principal climates, according to the
Thornthwaite classification. [After Blumenstock and Thornthwaite (1941).]

Global Weather Modification
Earth's atmosphere is unusual in that it has a relatively high oxygen content (about 21 percent). Most other planets have a reducing atmosphere. The free oxygen in today's atmosphere was probably produced largely by the activities of primary producers. The most plausible hypothesis to explain our planet's rather unusual atmosphere is that
activities of living organisms, particularly green plants and certain bacteria, play vital roles in the building and maintenance of air. Photosynthetic activities of plants utilize carbon dioxide and water to produce oxygen as a by-product, along with energy-rich reduced carbon compounds, such as glucose.
Free oxygen is released into the atmosphere by an inanimate process, too. High in the atmosphere above the ozone shield, ionizing solar radiation dissociates water vapor into molecular hydrogen and oxygen. Free oxygen is left behind as the light hydrogen atoms escape into outer space. In a reduced atmosphere, oxidation quickly uses up such free oxygen. Both of these oxygen-generating mechanisms have been important; dissociation was probably much more significant billions of years ago before the ozone layer was formed than it is at present (it will become more important as the ozone layer is further thinned by the release of chlorofluorocarbon gases). Ozone depletion has also increased ultraviolet radiation at the surface, which has almost certainly increased the frequency of skin cancers (though these may not be easily detectable for another decade).
Our atmosphere is in a complex quasi equilibrium, but CO2 concentration has risen steadily for the last quarter of a century and continues to rise due to
deforestation
and burning of fossil fuels. Over the past 30 years, consumption of fossil fuels has more than doubled
carbon emissions. This increase in atmospheric carbon dioxide has enhanced atmospheric heat retention
and would have produced global warming sooner except for a fortuitous spin-off of atmospheric pollution
-- particulate matter increased earth's albedo (reflectance of solar irradiation), so that less
solar energy penetrates to the surface (volcanic ash in the atmosphere has the same effect). Until
recently these two opposing phenomena more or less balanced one another, but now the balance has clearly
shifted and the "greenhouse effect" is leading to rapid
global warming
. Long-held meteorological
records the world over are being broken: the decades from 1990-2010 included the hottest years ever
recorded, including the lowest low pressure zone ever recorded in late summer followed in the next
winter by the highest high pressure area ever measured.
A very dangerous new greenhouse gas molecule has begun to appear in earth's atmosphere during the past few decades: trifluoromethyl sulfer pentafluoride (CF3SF5). Each molecule of this gas traps as much heat as 18,000 CO2 molecules (Sturges et al. (2000). This new molecule is increasing at 6% per year and it is exceedingly stable (half life = 1,000 years). This molecule was not present in air before about 1960, so it is man-made. However, its exact source remains unknown
--it could be an unintentional byproduct of some manufacturing process.
Desertification has been greatly accelerated during the past century due to above-mentioned processes. Arid areas are in a more precarious and perilous position than wetter areas. As the population burgeons, the last remaining natural habitats are rapidly being destroyed. Earth's atmosphere is being altered at an ever-increasing rate, leading to rapid weather modification. There is some concern that agents of infectious disease, such as malaria and cholera, will spread as a result of climatic change. Lyme disease spreads with mouse epidemics, and these could be more extreme now than they were when millions of passenger pigeons competed with mice for acorns. Moreover, new types of infectious diseases such as ebola, fungi, and hantavirus appear to be emerging, possibly as a result of habitat destruction and climate change. Global warming is having its impact on virtually all Earthlings, both plants and animals, including humans, and its effects will continue to intensify into the foreseeable future. Crop failures would seem to be inevitable.
Empty shelves in supermarkets will eventually awaken people to the dire danger of tampering with earth's atmosphere, but by then it will be much too late to rectify the situation. People will be appalled that scientists cannot restore the atmosphere to its former condition. But there can be no quick "technological fix" for Earth's maligned atmosphere. The continuing existence of all the denizens of this poor beleaguered planet, including ourselves, will ultimately depend more on our ecological understanding and wisdom than it will on future technological "advances."
Unlimited, cheap, clean energy, such as that much hoped for in the concept of cold fusion, would actually be one of the worst things that could possibly befall humans. Such energy would enable well-meaning but uninformed massive energy consumption (i.e., mountains could be leveled, massive water canals dug, ocean water distilled, water pumped to deserts and turned into green fields of crops). Heat dissipation would of course set limits, for when more heat is produced than can be dissipated, the resulting thermal pollution would quickly warm the atmosphere to the point that all life is threatened, perhaps the ultimate ecocatastrophe. (Die-hard technologists will no doubt argue that we will invent ways to shoot our excess heat out into space.)
Industrial pollutants cause acid rain, which can kill trees and fish. Recently, toxic levels of pesticides have been found in rain which has been linked to one of the most rapidly increasing cancers in the western world, non-Hodgkin's lymphoma. This type of cancer has increased by 73 percent in the last 25 years, probably directly due to several commonly used aerial crop sprays. Researchers suggest that the chemicals suppress immune systems, allowing viruses to trigger cancers (Pearce and Mackenzie 1999).
Selected References
Blair and Fite (1965); Blumenstock and Thornthwaithe (1941); Byers (1954); Chorley and Kennedy (1971); Collier et al. (1973); Finch and Trewartha (1949); Flohn (1969); Gates (1962); Haurwitz and Austin (1944); Lowry (1969); MacArthur (1972); MacArthur and Connell (1966); Taylor (1920); Thornthwaithe (1948); Trewartha (1943); U.S. Department of Agriculture (1941); Vitousek et al. (1986, 1997).
|