Professor, University of Texas at Austin
This article discusses the long-term rainfall patterns at the Fly Gap Division of the Double Helix Ranch, and the relationship between El Niño cycles and the droughts and wet periods common to this area of central Texas.
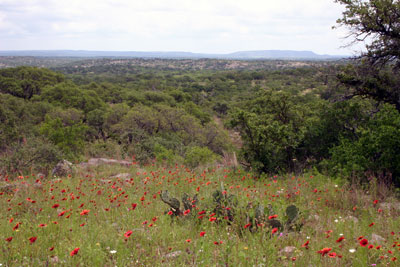
The Fly Gap Division of the Double Helix Ranch is located in central Texas, close to the geographical center of the state. The long-term average rainfall is about 26 inches per year (66 cm). However, an "average" year is quite rare. Instead, the ranch cycles regularly between wet periods (up to about double the average rainfall within a 12-month period) and dry periods (often as little as half the average rainfall). These wet-dry cycles are fairly regular, with "extreme" wet and dry periods occurring roughly every five years (see the graph below):
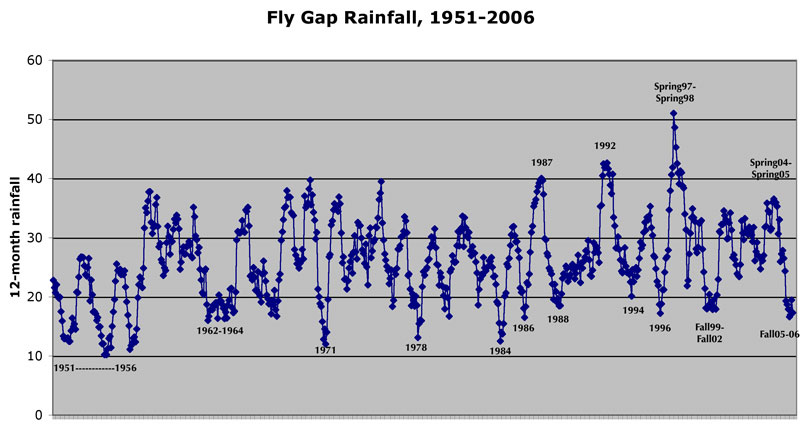
In this graph, each plotted point shows the monthly totals of rainfall for the previous 12 months. Since this 12-month moving sum always includes a full year, the cycles have no relationship to any seasonality (in other words, each 12-month period includes each of the months of January through December).
I have marked some of the major droughts and wet periods over the past 55 years. In particular, notice the severe drought of record in the early 1950s. Also, notice that the wettest wet periods have been in the past two decades.
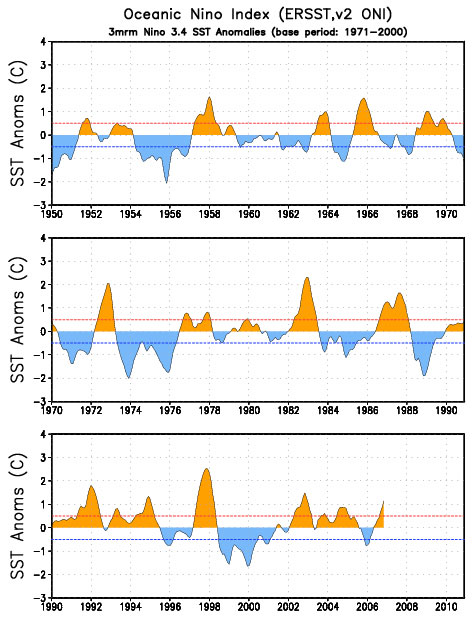
These wet-dry cycles are caused largely by the fluctuations in ocean temperatures in the western Pacific Ocean (the El Niño Southern Oscillation). When the western Pacific Ocean temperatures rise, rainfall in central Texas increases. When the these ocean temperatures fall, rainfall in central Texas decreases. Long periods of above-average Pacific Ocean temperatures are called El Niño events, and long periods of below average temperatures are called La Niña events. Specifically, the Ocean Niño Index (ONI) measures the departures in temperature from the long-term average in an area of the southern Pacific Ocean known as Niño 3.4. El Niño events are declared when the ONI is above 0.5 degrees (C) for five or more consecutive months, and La Niña events are declared when the ONI is below 0.5 degrees for five or more consecutive months.
The following graph from NOAA shows the El Niño/La Niña cycles since 1950:
If you compare the wet/dry cycles at Fly Gap to the El Niño/La Niña cycles, you will see that there is a close correlation. In fact, if we plot the ONI against the rainfall deviation from the long-term average, on a month-by-month basis for the past 20 years, the correlation is quite clear:
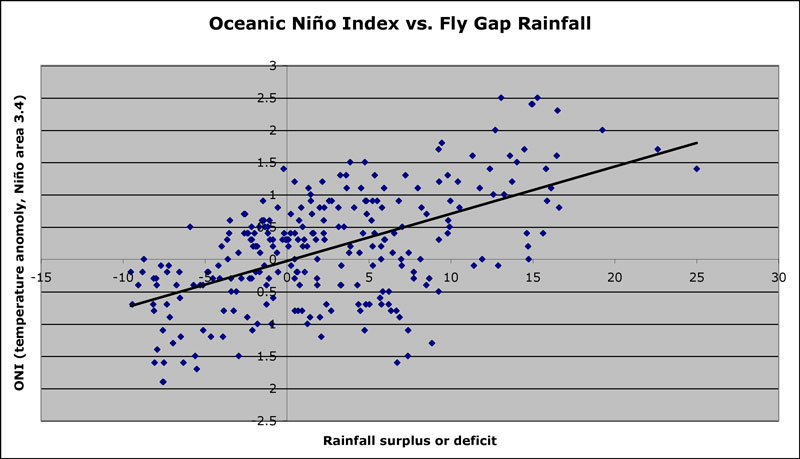
In particular, note that when the ONI is above 1.0, Fly Gap is virtually always wetter than average. When the ONI is below -1.0, Fly Gap is likely to be in drought (although this pattern is somewhat more variable). Some of the variation stems from the fact that El Niño episodes (when the ONI is high) tend to produce wet weather in central Texas from fall through spring, but drier than normal weather in the summers.
Also, notice that for the last 20 years, the ONI and Fly Gap rainfall have tended to be above their long-term averages, consistent with the world-wide patterns of global warming. In fact, global warming is likely responsible for a slow but consistent increase in our local average annual rainfall, as shown in the following two graphs (the first shows a linear trend line, the second a ten-year moving average):
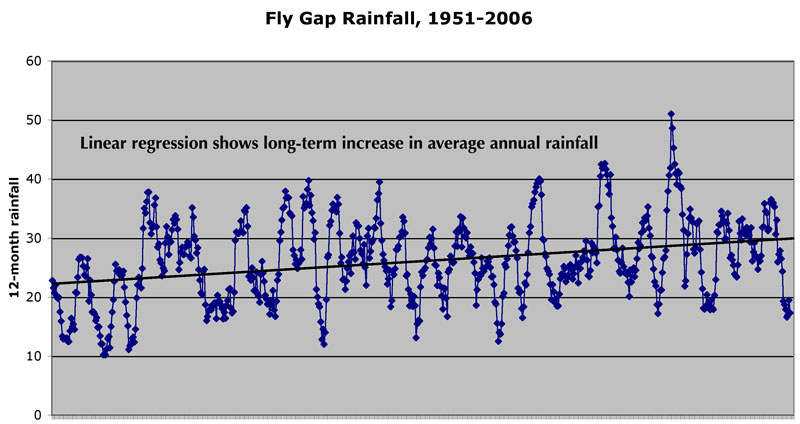
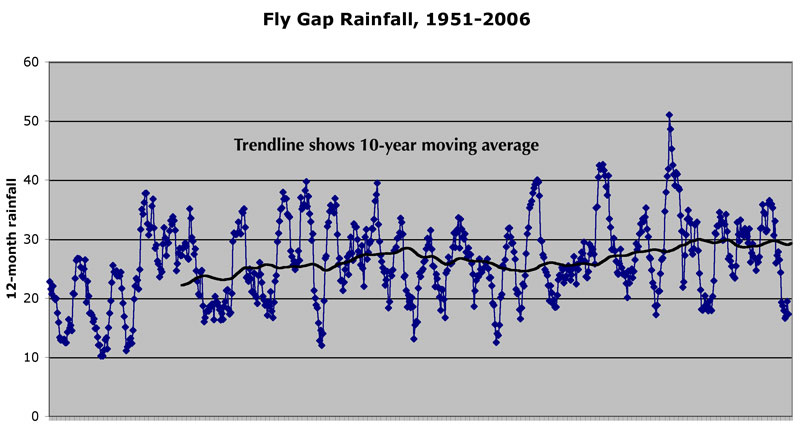
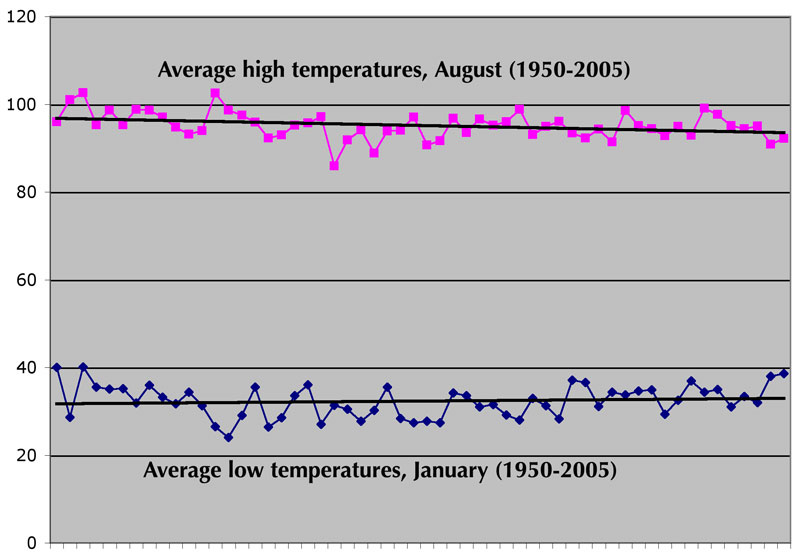
Although the average across all these years is about 26 inches, note that the annual average has shifted upward by almost 8 inches over the past 55 years (from about 22 to 30 inches per year)! Even though overall global warming appears to have contributed to this trend of locally increasing rainfall, the same effect has contributed to slightly more moderate temperatures locally. Increased cloud cover reduces high temperatures (shading effect), but also raises low temperatures (insulation effect). Thus, over the past 55 years, Fly Gap has seen a slight decrease in the average high temperatures in summer, and a slight increase in the average low temperatures in winter. The changes are slight but significant:
The effects from El Niño/La Niña cycles are particularly evident from fall through spring. If we compare El Niño years to La Niña years, and look at the rainfall from October to March, most El Niño years are wetter than average and most La Niña years are drier than average. In the following graph, El Niño years are shown in blue, and La Niña years in red:
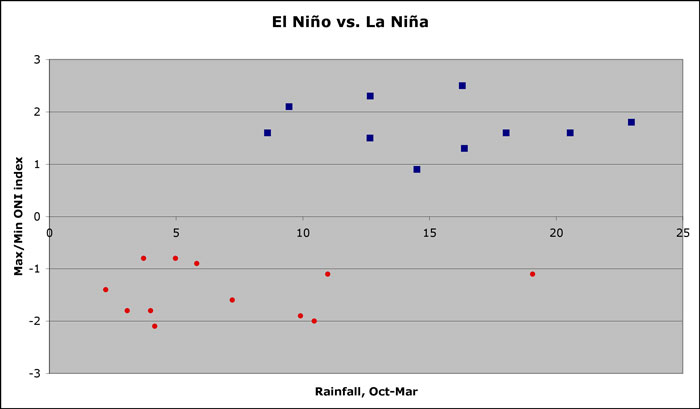
Note that almost all very wet years were El Niño years (the La Niña year of 1984-1985 was the exception), and all the very dry years were La Niña years. Some El Niño years and some La Niña years are about average, but they are in the minority.
When I first wrote this article, in summer 2006, the ONI was climbing out of negative territory it had been in since fall 2005 (when our 05-06 drought began). The ONI was predicted to increase, and to keep climbing for the remainder of 2006, suggesting moderate El Niño conditions developing in late 2006 and early 2007. This has happened exactly as predicted. This is beginning to bring us a return to wetter-than-average conditions, although most of the area in central Texas still has a long way to go to make up for the long drought. However, it looks like the spring and summer of 2007 are likely to be wet. [Update in June 2007: That prediction certainly proved to be true! We have had record-setting rains, and the drought is over.] Different models make somewhat different predictions for the coming months, but here is a summary of the predictions from the various models from the International Research Institute for Climate and Society with respect to future seas surface temperatires in the critical El Niño 3.4 region of the Pacific:
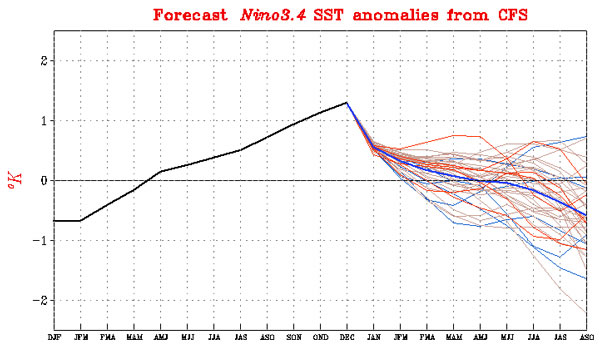
The blue line shows the mean of the forecasts by the various models, and suggests that our current El Niño cycle (five or more months with the ONI above 0.5 C) is predicted to end soon. This, in turn, suggests it is likely that Fly Gap will experience wetter than normal conditions in early 2007, with a likely return to closer to normal conditions later this year. If this prediction continues to hold true, then perhaps this will help end our latest drought. [Update in June 2007: The drought is now over, and we are having major flooding.] Notice the variability among the predictions from the different models, however, with some models predicting a continuing El Niño and others predicting a return to neuttral or even La Niña conditions. However, most of the models suggest that the ONI will remain in positive territory through spring 2007.
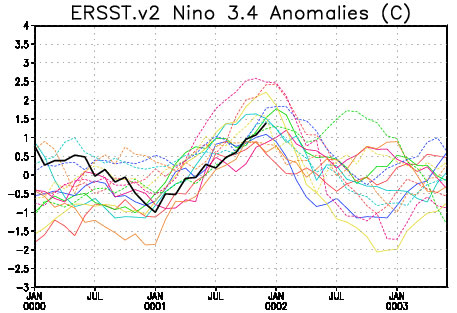
If we compare the current trends to past El Niño years, then the current conditions fall in the lower half of the Pacific warm-ups for those years. In the following graph, the current temperature deviations in El Niño area 3.4 (black line) are compared to previous El Niño years. The year marked "0001" is the year in which the El Niño developed in each case: