|
Point Diversity and Habitat Requirements © Eric R. Pianka MacArthur (1965) identified several different types of species diversity based on the size of the area sampled. He named two of these within-habitat diversity and between-habitat diversity. In the limit, as space is collapsed down to a single point, he suggested that 'point diversity' might be an informative measure as it avoids sampling area. Relatively few efforts have been made to estimate point diversity, but pit traps allow their measurement. 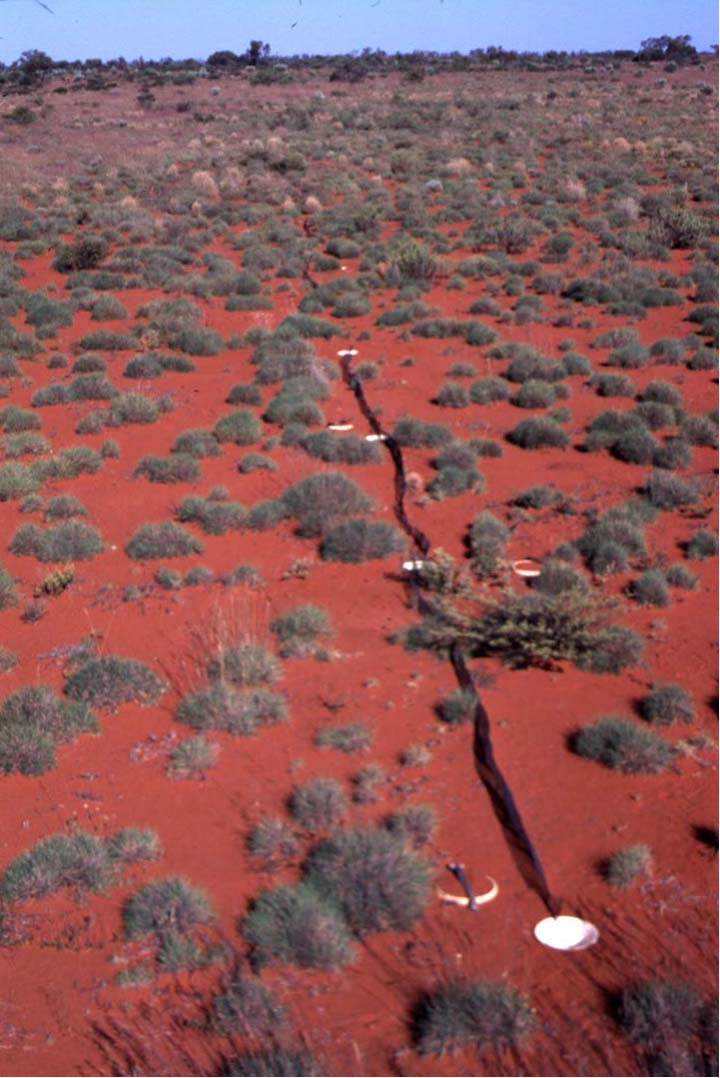
Pit trap line on the B-area. Pits were first installed on the L-area and at The R-area in September 1989. Five gallon plastic buckets were buried with their lips flush with the ground surface with drift fences about 20-25 cm high between pits. Individual pits were numbered. Additional pits were added in subsequent years, culminating in a total of 100 pits on the L-area, 100 pits at the R-area, and 75 pits on the B-area. Thousands of lizards have now been pit trapped at these 3 sites in the GVD from hundreds of pits arranged over a spatially heterogeneous landscape. A total of 62,226 pit trap days, most during 7 Austral Springs (September-November) from 1989-2008 has yielded 14,932 specimens. 
Pit trap data provide replicated estimates of point diversity through time. Pit traps vary widely in the numbers of individuals and species captured, as well as their relative abundances. Some pits are 'hot' and catch many more individuals and species than others. For example, some pits captured hundreds of individuals of dozens of species whereas others, in apparently similar habitats nearby, captured only dozens of individuals of just a few species over the same time interval. 
As explained above, some habitat-specialized species are found only on flat sand plains between ridges, and others occur only on sandridges. Still other species have more flexible habitat requirements. I will categorize what features of the landscape various lizard species respond to, and then classify pits by what species they catch using multivariate analysis. Sandridge pits clump together based on what they captured. Low-level, high-resolution aerial photographs were acquired of these three areas. Various landscape features such as sandridges, marble gum trees, acacia bushes, individual spinifex tussocks, termitaria, etc., can be seen clearly. Precise positions of pit traps were plotted on these aerial photographs. 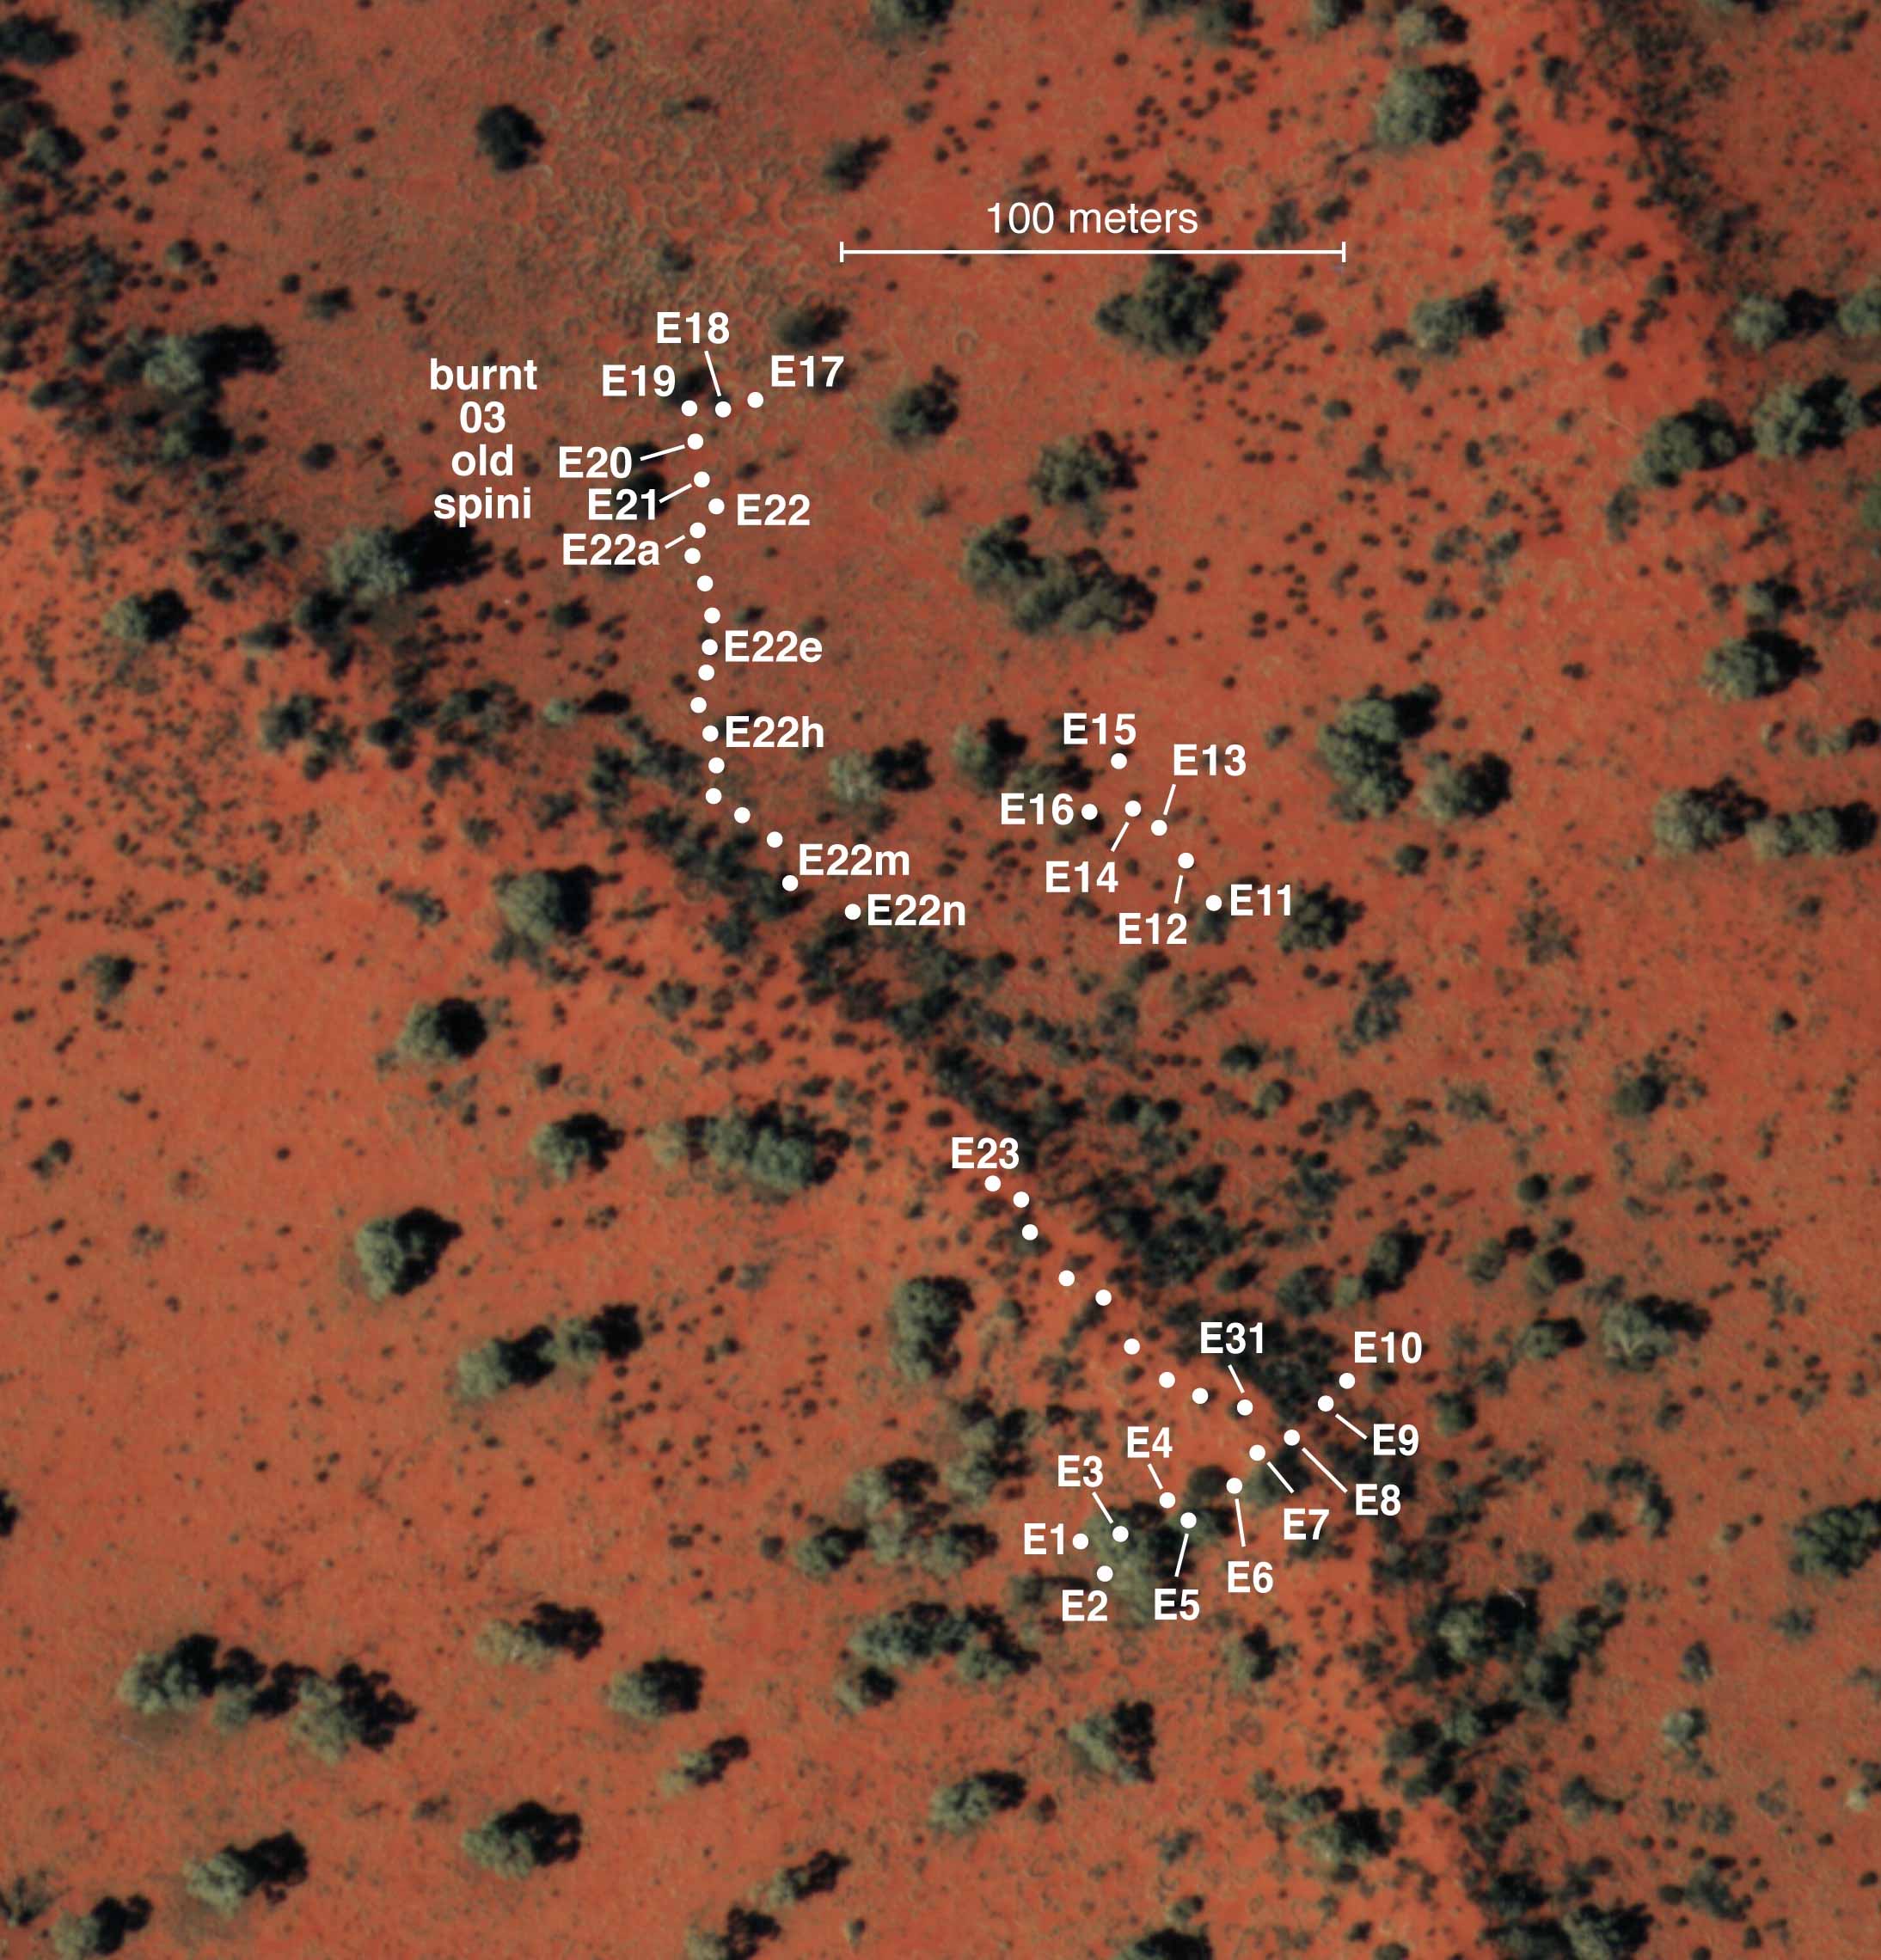
|
|
Point diversities were calculated using Simpson's index of diversity 1/Σpi2, where pi represents the proportion of lizard species i in any given pit trap. The following figure shows a histogram of point diversities for 78 pits at the Redsands study site broken down into each of four major habitats: flat, base, slope, and crest. Note the four outlier pits in the flat habitat. 

Principal component analysis of four vegetation categories plus open sand plus vegetation diversity. The first two PCs capture 67.2% of the variance. Pits in the flat and base fall out together, above those on the slope and crest, showing that vegetation covaries with habitat position. 
Lizard point diversity is inversely correlated with vegetation diversity. This correlation remains significant after removal of the four flat outliers (upper left). 
An ANCOVA analysis with lizard point diversity as the dependent variable using seven independent variables reduces variance in lizard point diversity by 58.9% (special thanks to N. L. Fowler). Correlations among each of seven variables are also shown. Values above diagonal in the correlation matrix are Pearson product moment correlation coefficients, those below the diagonal are non-parametric Spearman rank correlation coefficients. These data will be exploited to assess habitat requirements of various species, as well as whether species are positively or negatively correlated with each other over space and time. Strong positive and negative correlations between pairs of species will be identified (i.e., is species A likely to be captured in the same pits as species B, or are they unlikely to be captured together but found in different pits?). 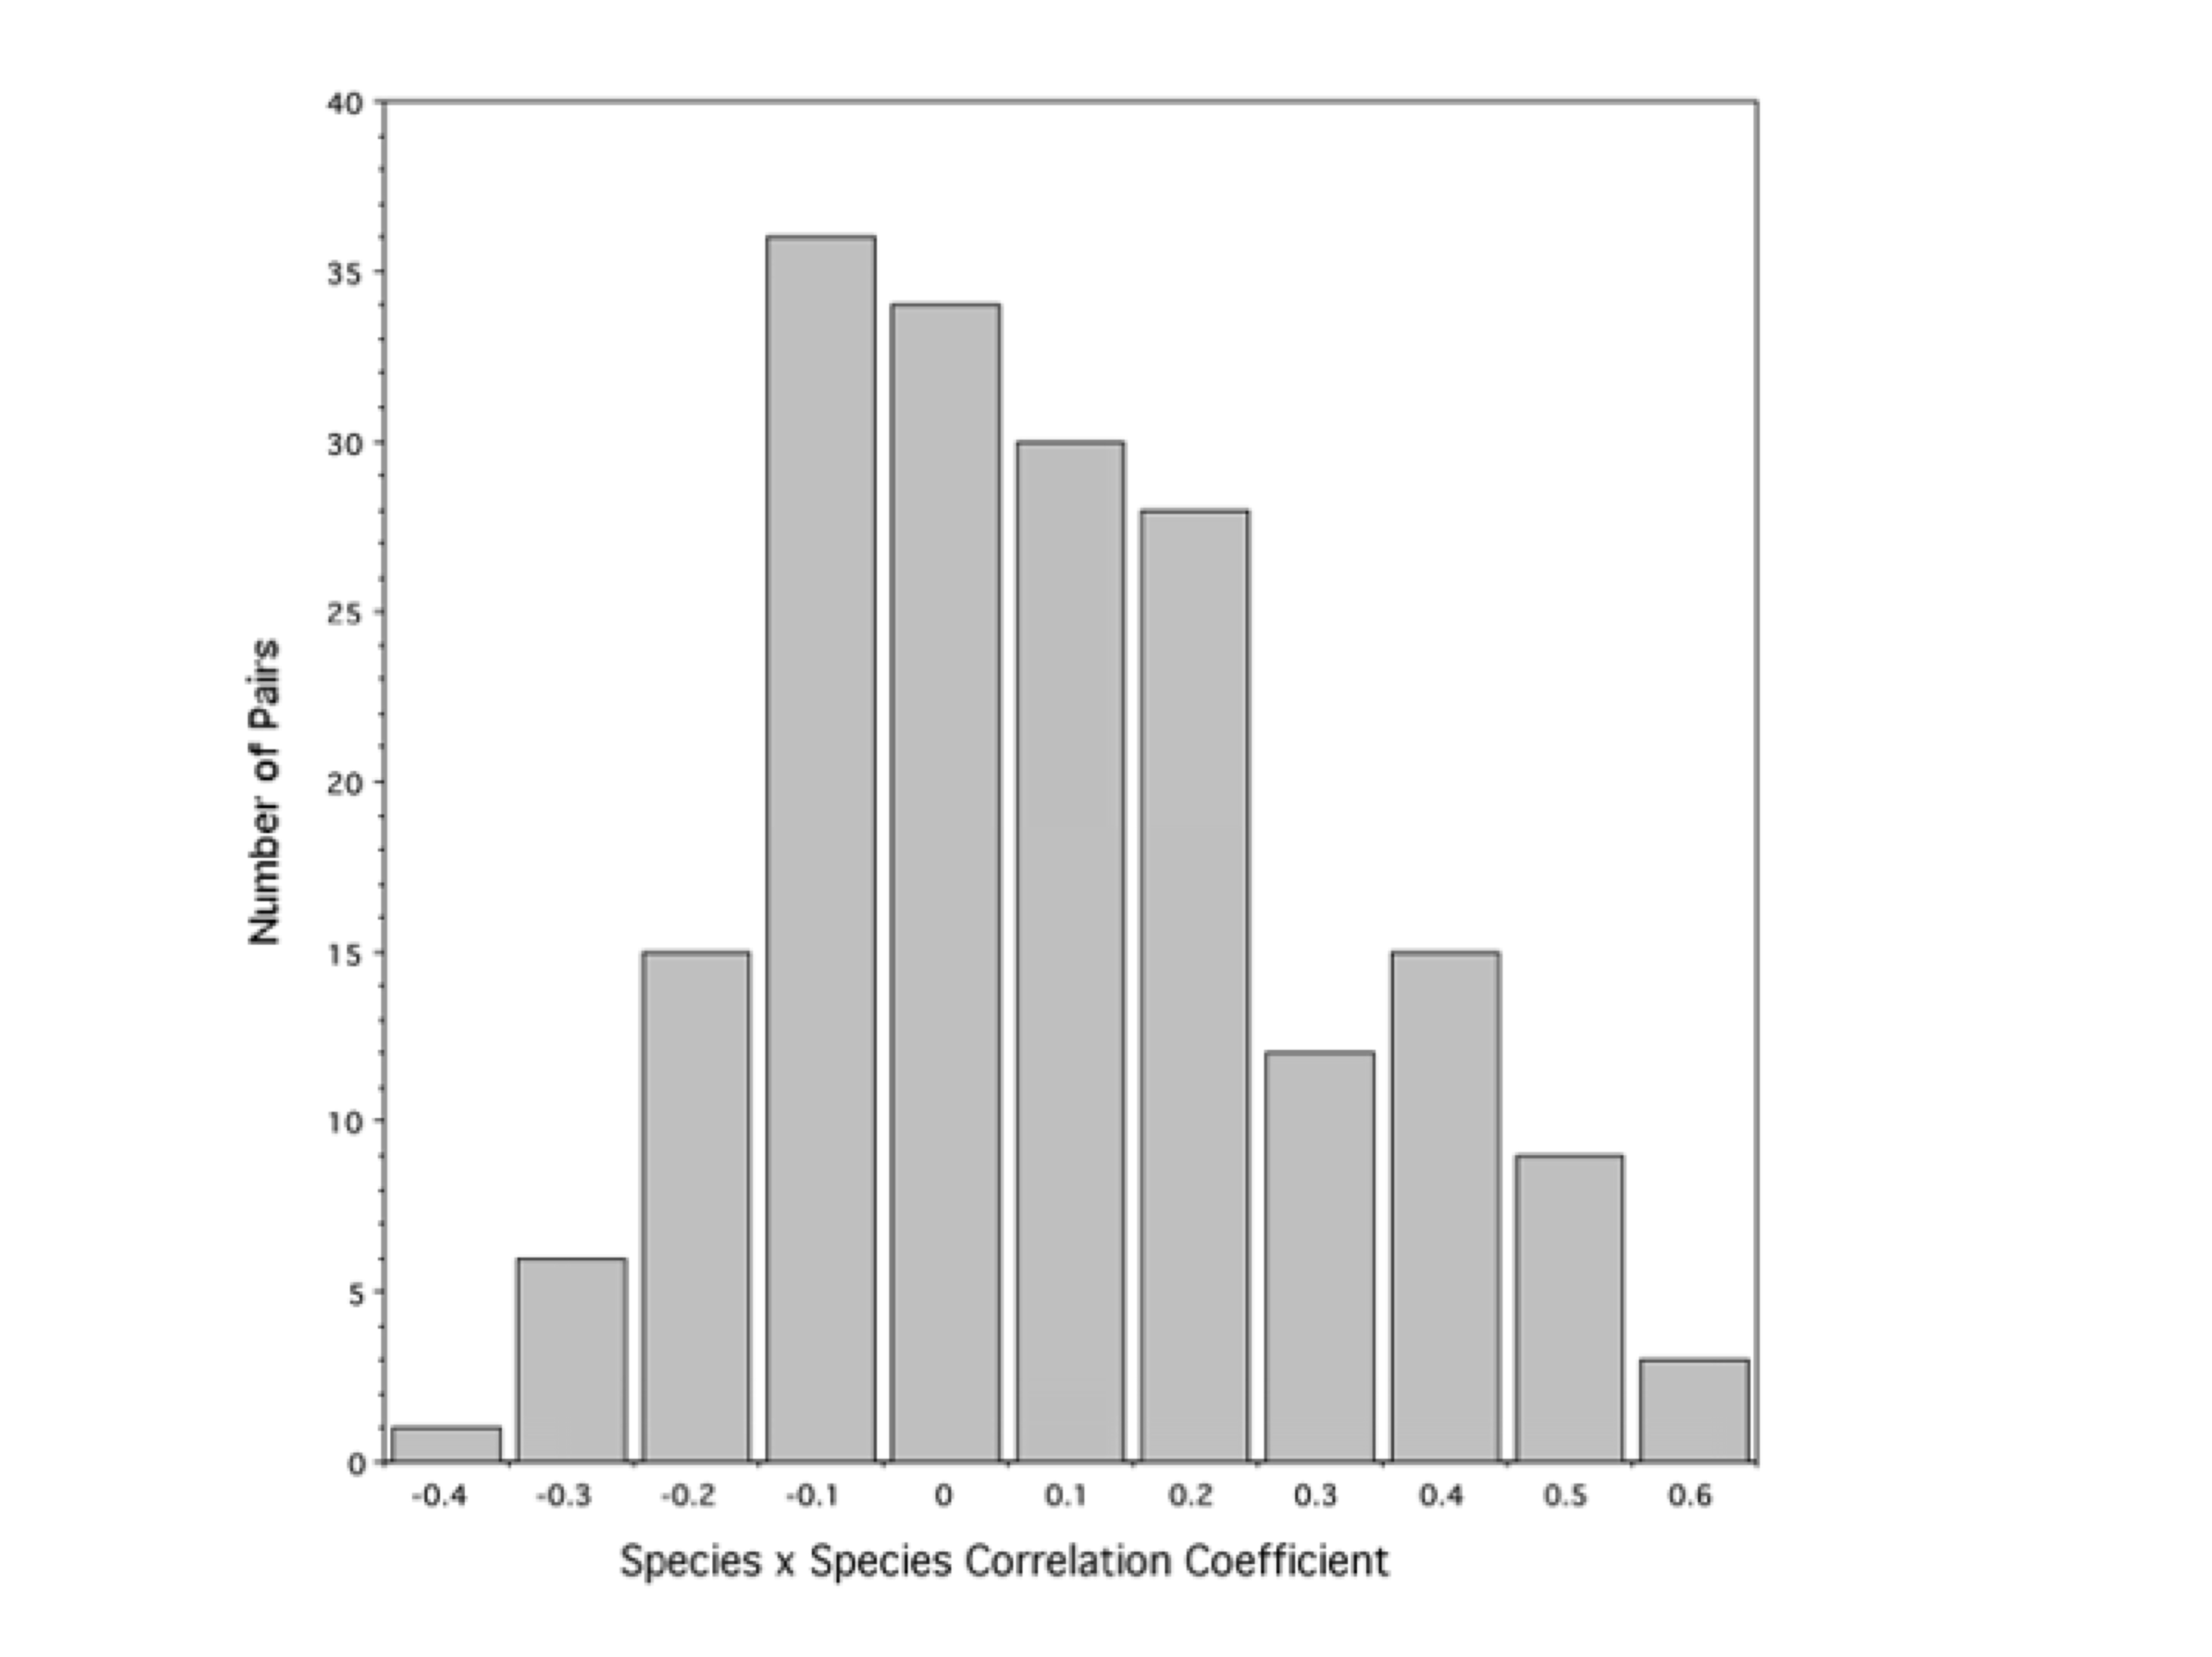
For each lizard species, I will look for correlations between how far pits that captured them are from various features. Size of buffer zones around pits will be decreased and increased in an effort to estimate appropriate size of neighborhoods for various lizard species. Some, such as monitor lizards move over great distances, whereas others, especially small species such as litter-specialized skinks, are much more sedentary. I will start with the most abundant species and work towards less abundant ones, which probably will not provide much signal and will obviously be harder to understand. This effort should also contribute to understanding rarity. References Gaston, K. J. 1994. Rarity. Population and Community Biology Series 13. Chapman and Hall. Kunin, W. E. and Gaston, K. J., eds 1997. The biology of rarity: causes and consequences of rare-common differences. Chapman and Hall. MacArthur, R. H. 1965. Patterns of species diversity. Biological Reviews 40: 510-533. Magurran, A. E. and P. A. Henderson 2003. Explaining the excess of rare species in natural species abundance distributions. Nature 422 (6933): 714-716. Download pdf. Main, A. R. 1982. Rare species: precious or dross? Graves, R. H. and W. D. L. Ride (eds): Species at risk: Research in Australia, pp. 163-174. Australian Academy of Science, Canberra. Download pdf. Morton, S. R., and C. D. James. 1988. The diversity and abundance of lizards in arid Australia: a new hypothesis. American Naturalist. 132: 237-256. Download pdf. Pianka, E. R. 1989. Desert lizard diversity: additional comments and some data. American Naturalist 134: 344-364. Download pdf. Pianka, E. R. 1996. Long-term changes in Lizard Assemblages in the Great Victoria Desert: Dynamic Habitat Mosaics in Response to Wildfires. Chapter 8 (pp. 191-215) in M. L. Cody and J. A. Smallwood (eds.) Long-term studies of vertebrate communities. Academic Press. Download pdf. |