 
© Eric R. Pianka ABSTRACT Most species of Australian desert lizards are uncommon. Possible causes of rarity are examined, including body size as measured by snout-vent length (SVL), fecundity, number of sites occupied, habitat niche breadth, microhabitat niche breadth, dietary niche breadth, and average total niche overlap with other species. Rare species tend to be larger with lower fecundities than abundant species and they occur at fewer sites. Many, but not all, uncommon species are specialists, either in habitat, microhabitat, or diet. The niche breadth hypothesis, which states that abundant species should be generalists whereas specialized species should be rare, is tested, but rejected as a general explanation for rarity. Some uncommon species exhibit high overlap with other species suggesting that they may experience diffuse competition. However, no single cause of rarity can be identified, but rather each species has its own idiosyncratic reasons for being uncommon. Multivariate analyses show distinct ecological differences between abundant and uncommon species. INTRODUCTION  Understanding rarity constitutes a major challenge for ecologists.
Main (1982)
asked "Are rare species precious or dross? And, are they vital to community function?"
Do rare species persist in more stable communities in spite of their rareness, or does
the presence of rare species enhance the stability of ecosystems? Main (1982) suggested
that one reason so many rare species exist may be that ecosystems have been "over-written
many times after imperfect erasures" (incomplete extinctions). Consequently, current
ecosystems contain numerous relicts of their predecessors assembled under different conditions.
Main suggested that rare species could be vital to long-term ecosystem sustainability, providing
'insurance' for the delivery of ecosystem functions by alternative means in the event of drastic
environmental changes. Main's hypotheses could well be of great importance in these times of
rapid climatic change.
Understanding rarity constitutes a major challenge for ecologists.
Main (1982)
asked "Are rare species precious or dross? And, are they vital to community function?"
Do rare species persist in more stable communities in spite of their rareness, or does
the presence of rare species enhance the stability of ecosystems? Main (1982) suggested
that one reason so many rare species exist may be that ecosystems have been "over-written
many times after imperfect erasures" (incomplete extinctions). Consequently, current
ecosystems contain numerous relicts of their predecessors assembled under different conditions.
Main suggested that rare species could be vital to long-term ecosystem sustainability, providing
'insurance' for the delivery of ecosystem functions by alternative means in the event of drastic
environmental changes. Main's hypotheses could well be of great importance in these times of
rapid climatic change.
 Most species of Australian desert
lizards are uncommon, making them difficult to study. Some are extremely rare to the point of vanishing
rareness (Pianka 2011, 2014). Regardless of how rareness is
defined, most ecologists concur that the majority of species are indeed uncommon (Gaston 1994,
Kunin and Gaston 1997). Magurran and Henderson (2003) distinguished between relatively abundant
"core species" and uncommon "occasional species". Chronic rarity has proven to be exceedingly difficult
to study, but, as mentioned above, rare species could well be very important to community
function (Main 1982, Morton and
James 1988; Kunin and Gaston 1997; Preston 1948, 1962; Thompson et al. 2003). Most species of Australian desert
lizards are uncommon, making them difficult to study. Some are extremely rare to the point of vanishing
rareness (Pianka 2011, 2014). Regardless of how rareness is
defined, most ecologists concur that the majority of species are indeed uncommon (Gaston 1994,
Kunin and Gaston 1997). Magurran and Henderson (2003) distinguished between relatively abundant
"core species" and uncommon "occasional species". Chronic rarity has proven to be exceedingly difficult
to study, but, as mentioned above, rare species could well be very important to community
function (Main 1982, Morton and
James 1988; Kunin and Gaston 1997; Preston 1948, 1962; Thompson et al. 2003).
Over the last 42 years, I have witnessed metapopulation-like local extinctions and colonization in a few species. I have captured migrants of a number of species (Ctenophorus fordi, Ctenophorus scutulatus, Ctenotus greeri, Ctenotus leae, Ctenotus leonhardii, Lophognathus longirostris, Nephrurus vertebralis, and Tiliqua occipitalis) dispersing through habitats that they do not normally occupy. Until recently, inadequate sample sizes have prevented me from doing much with uncommon species, but I have now finally managed to acquire large enough samples to attempt to understand the ecologies of most of them -- no one else has ever managed to collect such large samples of uncommon Australian desert lizards. The Great Victoria Desert of Australia is predominantly sandy with red sands, and supports a vegetation consisting mainly of so-called "spinifex" or "porcupine" grasses (genus Triodia) plus various species of gum trees (Eucalyptus). In wetter places and on harder soils, tracts of "mulga" (Acacia aneura) occur. Occasional dry lakebeds are inhabited largely by various shrubby chenopod species (including Atriplex lindleyi). Stabilized long red sandridges, parallel to prevailing winds are scattered throughout the Great Victoria Desert, particularly in the eastern interior. Extensive areas of sandplain occur as well. The region is very heterogeneous and mixed habitats of shrubs, Triodia, Acacia, Grevillea, Hakea, and Eucalyptus occur on desert loams and sandy soils. Study sites A and M are on such ecotonal mixed areas. "Red Sands" (area R) and area E are sandridge sites with marble gum trees (Eucalyptus gongylocarpa), a few desert bloodwood trees (Eucalyptus sp.), extensive spinifex (Triodia), and a variety of sandridge perennials (Acacia, Grevillea, and Hakea). On area D, a few scattered smaller sandridges and sand dunes support a lower and more open vegetation with fewer trees. Sandplain habitats also occur on these three study sites between sandridges. Two other areas, G and L, consist solely of such flat or gently rolling sandplains, with large marble gum eucalypt trees, spinifex and some scattered bushes. Areas B and N are "pure" spinifex flats (treeless grass desert), whereas area Y is a relatively pure (nearly treeless) shrub desert site in a dry lakebed. Several expeditions were undertaken to the Western Australian deserts, the first in 1966-68 when eight areas were selected for study (see Pianka 1969), and the second in 1978-79 when two sites were chosen for more intense analyses (one of these, area L, was also among the original eight and thus was examined on both trips. "Red Sands" (area R) has been studied most intensively over the last 30 years and provides the best data for analysis of fluctuations in abundance through time. A new study site, the B-area was established in 1992. I returned to three of these sites several more times during 1989-2008. Except for some type specimens lodged in the Western Australian Museum, all of the 1966-68 specimens are lodged in the Los Angeles County Museum of Natural History. Australian specimens collected since then are lodged in the Western Australian Museum (negotiations are currently underway with WAM to deposit a large synoptic collection in the Texas Memorial Natural History Museum here in Austin, Texas). I continued to monitor the Australian saurofaunas at the L-area and Redsands during 1989-1991 when I set up extensive pit trap lines. A field assistant ran pit trap samples for 3 months during the Austral Spring of 1992. A new study site, the B-area, with pit trap lines was set up in 1992 and monitored before a controlled burn -- it was burned in October 1995 and I have continued to monitor it for 13 years following the fire during 1995, 1998, 2003 and 2008 to assess changes in community structure (Pianka and Goodyear 2012). Fire is increasingly recognized as a major contributor to species density and ecology. My long-term census data provide insights into how individual species respond (species composition, relative abundance, dietary flexibility, and reproductive tactics). A total of 2846 individual lizards representing some 46 species have been collected at the B-area from 1992 through 2008. Stomach contents of these lizards reflect how arthropod prey resources change during the fire succession cycle (Pianka and Goodyear 2012). I began studies at Red Sands in 1978-79 (N = 1436) under a Guggenheim Fellowship, continued them during 1989-92 (N = 3196) with support from the National Geographic Society and as a Fulbright Senior Research Fellow, and have made subsequent collections in 1995-96 (N = 2358), 1998 (N = 1272), 2003 (N = 895), and 2008 (N = 1075). Similarly, I have conducted censuses on the L-area in 1966-68 (N = 532), 1978-79 (N = 1567), and 1989-92 (N = 1997). These data have been used to study long-term changes (Pianka 1996) such as those that occur in response to fires (Pianka and Goodyear 2012) and shrub encroachment due to increased precipitation (global weather modification). Lizard abundance and species richness both decreased from 1998 to 2008 as evidenced by sampling the exact same pits during the same months 3 times in ten years ranging from September-December 1998 to September-December 2003 and once again during September-December 2008. On seven separate research expeditions from 1966 to 2008 (Pianka 1969a, 1969b, 1982, 1986, 1994, 1996; Pianka and Goodyear 2012), extensive data were gathered at ten major study sites in the Great Victoria Desert of Western Australia (for exact locations, see Pianka 1986 and Pianka and Goodyear 2012). Lizards were collected by any means possible using a wide variety of different techniques including exhuming, grabbing, noosing, shooting, tracking, finding geckos at night by eyeshine, and pit trapping. Early on (1962-68, 1978-79), lizards were hunted and captured during their normal daily course of activity, providing data on time of activity, microhabitat, ambient air temperature, and active body temperature. These data suffered, however, from collector bias and do not provide very reliable estimates of relative abundance. I changed my research protocol in 1989, since then all lizards have been pit trapped with drift fences between traps. Trappability varies from species to species: slow moving species, especially agamids like bearded dragons and thorny devils, often walk around pits whereas most skinks run rapidly down drift fences and readily fall into pit traps. Nevertheless, pit trapping provides a standardized collecting method that allows relative abundances to be compared across space and time. This technique also allows informative estimates of point diversity, which can be exploited to infer habitat requirements. Data acquired up until 1979 were summarized with totals and means as appendices in Pianka (1986). Ecology has changed dramatically in the past few decades, with much greater emphasis now being placed on conservation biology, rare species, and phylogenetically corrected analyses of evolution using modern comparative methods. Whereas data collected before 1979 were intended for studying niche partitioning and community structure, data collected since 1989 using pit traps were designed to study rare species, fire succession, long-term change, habitat and microhabitat requirements, adaptive radiations, and phylogenetic constraints. Thus, these new data complement the older data and are qualitatively different than those collected earlier.
While no data on relative abundance are perfect, I have managed to amass enough data to categorize species as common, rare or intermediate. Moreover, here I test several hypotheses such as "are rare species specialists?" on each of various niche dimensions (habitat, microhabitat, diet). And, I exploit multivariate methods to show that rare species differ from abundant ones. Although these data and analyses are imperfect, I doubt that anyone will ever be in a better position to analyze rarity in Australian Desert Lizards. 
Several hypotheses, not all of which can be tested here, for the continued existence of rare species spring to mind: H 1. Body size-trophic level hypothesis. Larger species are uncommon either because they are top predators (monitor lizards) or for other reasons. H 2. Fecundity hypothesis. Some species could be uncommon due to their low fecundity. H 3. Geographic range hypothesis. Rare species could have narrow geographic ranges, occurring at only a few sites (Rabinowitz et al. 1986). H 4. The niche breadth hypothesis. Rare species are uncommon because they are specialized with narrow niche requirements. Resources such as habitats, microhabitats, or foods might be scarce or limited. These alternatives can be tested with data on niche breadths (below). H 5. Diffuse competition hypothesis. Rare species could be uncommon due to diffuse competition from many other, more abundant, species (MacArthur 1972b). H 6. Physical environmental tolerance hypothesis. Rare species might have narrow tolerances to physical environments. H 7. Sink versus source hypothesis. Rare species might be uncommon only locally in 'sink' populations, but might be more abundant in nearby 'source' areas. H 8. Dispersal hypothesis. Rare species could be rare because they do not have dispersal powers necessary to find and invade suitable habitats. Are rare species merely accidentals, dispersing from one habitat to another? H 9. Predator hypothesis. Predators could hold population densities of uncommon species at low levels. Some related questions that can be asked about rare species include: Merely being in an alien habitat is not necessarily a death sentence, as these habitats offer shelter and food -- a migrant that succeeds in reaching its correct habitat could also reap the benefits of sweepstakes reproductive success. Which of these factor(s) is/are crucial determinants of commonness or rarity needs to be determined for each species. METHODS Field Collections In the past few decades, ecology has gradually changed with greater emphasis now being placed on conservation biology, rare species, and phylogenetically corrected analyses of evolution using modern comparative methods. Whereas data collected before 1979 were intended for studying niche partitioning and community structure, data collected since 1989 using pit traps were designed to study rare species, fire succession, long-term change, habitat and microhabitat requirements, adaptive radiations, and phylogenetic constraints. New data thus complement older data but are qualitatively different than those collected earlier. 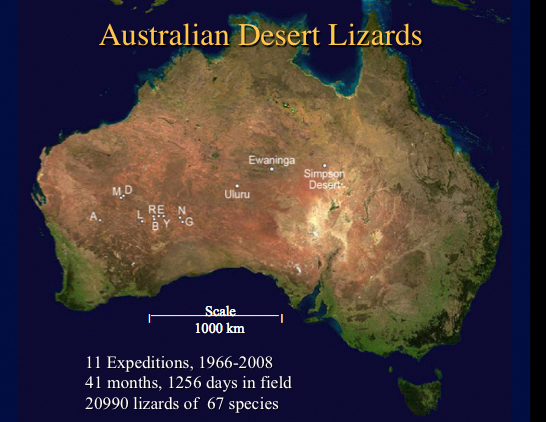
Early on (1966-68, 1978-79), lizards were hunted and captured during their normal daily course of activity, providing data on time of activity, microhabitat, ambient air temperature, and active body temperature. Data acquired up until 1979 were summarized with totals and means as appendices in Pianka (1986). These data suffered, however, from collector bias and do not provide very reliable estimates of relative abundance. I changed my research protocol in 1989, since then all lizards have been pit trapped with drift fences between traps. Trappability varies from species to species: slow moving species, especially agamids like bearded dragons and thorny devils, often walk around pits whereas most skinks run rapidly down drift fences and readily fall into pit traps. Fossorial Lerista bipes are exceptionally prone to fall into pit traps. Arboreal species are less likely to be trapped than terrestrial species. Nevertheless, pit trapping provides a standardized collecting method that allows relative abundances to be compared across space and time. This technique also allows informative estimates of point diversity, which can be exploited to infer habitat requirements. To maximize sample sizes, I combine all data here and classify species into three broad natural abundance categories: common, rare, and species of intermediate abundance (see Fig. 1). Niche breadths were computed for each species based on proportional representation of each resource category using the inverse of Simpson's (1949) index of diversity, 1/Σpi2, where pi is the proportion of lizards using resource state i. Standard multivariate statistical methods including principal component analysis and discriminant function analysis were employed. RESULTS Over the last 42 years, I have witnessed metapopulation-like local extinctions and colonization in a few species. I have captured migrants of a number of species (Ctenophorus fordi, Ctenophorus scutulatus, Ctenotus greeri, Ctenotus leae, Ctenotus leonhardii, Lophognathus longirostris, Nephrurus vertebralis, and Tiliqua occipitalis) dispersing through habitats that they do not normally occupy. Until recently, inadequate sample sizes have prevented me from doing much with uncommon species, but I have now finally managed to acquire large enough samples to attempt to understand the ecologies of most of them -- no one else has ever managed to collect such large samples of uncommon Australian desert lizards. One species, the Great Desert Skink Liopholis (formerly Egernia) kintorei merits special comment. One juvenile specimen of this very rare nocturnal lizard was collected on my L-area in 1967. This represents the southernmost known locality for the species and its identity has been confirmed by experts. Despite considerable effort, no others were found either at the L-area or on any other study area. This singleton may have been among the last of its kind, now considered endangered in Western Australia and possibly on its way to extinction (Pearson et al. 2001). 
Figure. Abundances of 15 species of Ctenotus skinks plotted against the size of their geographic ranges. Widespread species are not necessarily common, but species with narrower ranges such as Ctenotus quattuordecimlineatus can be much more abundant locally. Hence, H 3 (above) is not supported. 
Figure. Histograms showing the number of abundant species (blue), species of intermediate abundance (green), and rare species (red) found at 10 different study sites in the Great Victoria Desert. Rare species tend to be found on fewer sites, but one rare species is found on all 10 study areas. Species of intermediate abundance are distributed bimodally, with some occurring at only a few sites but others are present on most sites. Abundant species are also bimodally distributed and occur at a greater number of sites on average. These data also do not support H 3 (above). 
Australian desert lizards occur at four different habitat types in sandridge deserts: crest, slope, base, and flat (shown in above figure). Some species are largely restricted to one of these habitats, but other species display more generalized habitat requirements. Habitat niche breadths were computed for each species based on proportional representation in each of the four habitats using Simpson's index of diversity, 1/Σpi2, where pi is the proportion of lizards found in habitat i. Habitat niche breadths range from 1 to 4 (below). 
Figure. Histograms of habitat niche breadths of abundant species (blue), species of intermediate abundance (green), and rare species (red). Many rare species are habitat specialists, as are some intermediate and a few abundant species. Habitat niche breadths are broadest in abundant species and those of intermediate abundance, although 6 rare species also have broad habitat niches. In all three abundance categories, species exhibit the full range of habitat niche breadths. The niche breadth hypothesis (H 4 above) is not strongly supported by these data on habitat niche breadths. 
Each lizard was assigned to one of 15 different microhabitat resource categories. Microhabitat niche breadths were computed using Simpson's index of diversity. The above figure shows histograms of microhabitat niche breadths for abundant species (blue), species of intermediate abundance (green), and rare species (red). Most abundant species and many rare species are microhabitat specialists, as are a few species of intermediate abundance. Surprisingly, microhabitat niche breadths are narrowest in abundant species. Many species of intermediate abundance exhibit broad microhabitat niches. A few rare species are actually microhabitat generalists. Hence, again, the niche breadth hypothesis (H 4 above) seems to be refuted by these data on microhabitat niche breadths. 
To estimate dietary niche breadth, 20 prey categories were recognized, corresponding mostly to arthropod orders plus categories for plant and vertebrate food items. Simpson's index was again used to estimate dietary niche breadths. Species in all three abundance categories exhibit a wide range of food niche breadths. As with microhabitat niche breadths, dietary niche breadths on average are narrowest in abundant species and broadest in species of intermediate abundance. Abundant species and those of intermediate abundance have bimodal distributions, with some relatively specialized species and others with broader diets. Rare species are distributed more uniformly, with a complete range of food niche breadths. Hence, once again, the niche breadth hypothesis H 4 is not supported by these data on dietary niche breadths. 
Microhabitat niche breadths are weakly positively correlated with dietary niche breadths in all three abundance categories, although a great deal of scatter exists. In all three abundance categories, some species are both dietary and microhabitat specialists. Several species of intermediate abundance exhibit narrow diets but relatively broad microhabitat niche breadths, whereas others, including several rare species, have broad niches on both dimensions. 
To attempt to test the diffuse competition hypothesis (H 5), the logarithm of abundance is plotted against the average total dietary overlap with all other species in the above figure. The correlation goes against the prediction with higher overlaps among more abundant species. In the next table, abundances and values of each of nine variates are listed for each of the 12 most abundant species, along with averages for all abundant species plus those for all species. Values that deviate above or below expected values are highlighted in bold. As expected, all the abundant species are small and all but a couple are widespread, occurring on most sites. Also, as expected, most tend to have broad niches though some are specialists. 
In the following table, abundances and values of each of nine variates are listed for each of the 18 species of intermediate abundance, along with averages for all intermediate species plus those for all species. Again, values that deviate from expected are highlighted in bold. 
The following table lists abundances and values of each of nine variates for each of 33 rare species, along with averages for all species. Values that deviate as expected for rare species are highlighted in bold. Eight rare species are large. Most, but not all, are found at only a few sites. Eleven experience high dietary overlap, hence presumed diffuse competition. Many rare species have narrow niche breadths. Each and every rare species displays at least one value expected to be associated with rarity. Many exhibit several values as predicted. 
The following table summarizes correlations and partial correlations among variates with the logarithm of abundance. The three strongest correlations (shown in bold) are with the number of sites, habitat niche breadth, and dietary overlap. Results of stepwise multiple regression with the logarithm of abundance as the dependent variable are given below the table. These 3 variables reduce the variance in the logarithm of abundance by 59.8%. 
The first two principal components (shown below) of a PCA analysis based on the same 9 variates capture 46.3% of the variance. Rare species tend to be separated from common species and those of intermediate abundance. Adding PC3 and PC4 (not shown) reduces residual variance by a further 26.9%, for a total of 73.2%. 
A discriminant function analysis based on the same 9 variables clearly separates the 12 abundant species from the less common species. Some overlap occurs between rare species and those of intermediate abundance (figure below), but species in these two abundance categories display some separation. 
While some species may be rare because of narrow niche requirements, other specialized species can be abundant. No general explanation for rarity may exist, but rather each species may have its own idiosyncratic reasons for being uncommon. Many of the possible factors that could contribute to rarity remain to be evaluated, and the difficulty of studying uncommon species remains a formidable challenge to ecologists. Caveat: Returning to Main's question "How important are rare species to the function and stability of communities?" Foregoing analyses are overly simplistic in that they assume abundances and niche breadths remain fixed in time, but of course, they must vary. These lizard populations can be viewed more realistically using a metaphor: their relative abundances are analogous to 3-dimensional waves in as many dimensions as there are species: the vertical coordinate represents the abundances of each of the various species moving up and down and around in space and time. At any given time, some species are abundant while others may be scarce. These abundance surfaces are relatively placid for some species, but very rough for others. Some species like Ctenophorus clayi and Ctenophorus nuchalis boom and bust, exhibiting intermittent rarity, whereas others like Cyclodomorphus, Eremiascincus, and Tiliqua, are always uncommon (chronic rarity). Still other common species, like Ctenophorus isolepis, exhibit more stable populations. These waves of relative abundance respond to fire and episodic precipitation events (see Fire Succession on the B-area), both of which drive changes in resource availabilities of prey and microhabitats through time and space. One of my long-term goals is to attempt to model this multidimensional spatial-temporal wave-like landscape. REFERENCES Gaston, K. J. 1994. Rarity. Population and Community Biology Series 13. Chapman and Hall. Goodyear, S. E. and E. R. Pianka. 2011. Spatial and temporal variation in diets of sympatric lizards (genus Ctenotus) in the Great Victoria Desert, Western Australia. J. Herpetology 45: 265-271. Read On Line. Download pdf Kunin, W. E. and Gaston, K. J., eds 1997. The biology of rarity: causes and consequences of rare-common differences. Chapman and Hall. MacArthur, R. H. 1969. Species packing and what interspecific competition minimizes. Proc. Nat. Acad. Sci. USA 64: 1369-1371. MacArthur, R. H. 1970. Species packing and competitive equilibrium for many species. Theoret. Population Biol. 1: 1-11. MacArthur, R. H. 1972a. Strong, or weak, interactions? Trans. Conn. Acad. Arts and Sci. 44: 177-188. MacArthur, R. H. 1972b. Geographical Ecology. 269pp. Harper and Row. Magurran, A. E. and P. A. Henderson 2003. Explaining the excess of rare species in natural species abundance distributions. Nature 422 (6933): 714-716. Download pdf. Main, A. R. 1982. Rare species: precious or dross? Graves, R. H. and W. D. L. Ride (eds): Species at risk: Research in Australia, pp. 163-174. Australian Academy of Science, Canberra. Download pdf Morton, S. R., and C. D. James. 1988. The diversity and abundance of lizards in arid Australia: a new hypothesis. American Naturalist. 132: 237-256. Download pdf. Pianka, E. R. 1996. Long-term changes in lizard assemblages in the Great Victoria Desert: Dynamic habitat mosaics in response to wildfires. Chapter 8 (pp. 191-215) in M. L. Cody and J. A. Smallwood (eds.) Long-term Studies of Vertebrate Communities. Academic Press. Download pdf Pianka, E. R. 2011. Notes on the ecology of some uncommon skinks in the Great Victoria Desert. Western Australian Naturalist 28: 50-60. Download pdf Pianka, E. R. 2014. Rarity in Australian Desert Lizards. Austral Ecology 39, in press. Early View Pianka, E. R. and S. E. Goodyear. 2012. Lizard responses to wildfire in arid interior Australia: Long-term experimental data and commonalities with other studies. Austral Ecology 37: 1-11. Download pdf Preston, F. W. 1948. The commoness and rarity of species. Ecology 29: 254-283. Preston, F. W. 1962. The canonical distribution of commoness and rarity. Ecology 43: pp. 185-215 and 410-432. Rabinowitz, D., S. Cairns and T. Dillon. 1986. Seven forms of rarity and their frequency in the flora of the British Isles. In M.E. Soule; (ed.) Conservation Biology: The Science of Scarcity and Diversity. pp. 182-204. Sinauer, Sunderland, Massachusetts. Simpson, E. H. 1949. Measurement of diversity. Nature 163: 688. Thompson, G. G., P. C. Withers, E. R. Pianka, and S. A. Thompson. 2003. Assessing biodiversity with species accumulation curves: Inventories of small reptiles by pit-trapping in Western Australia. Austral Ecology 28: 361-383. |